Fig. 2
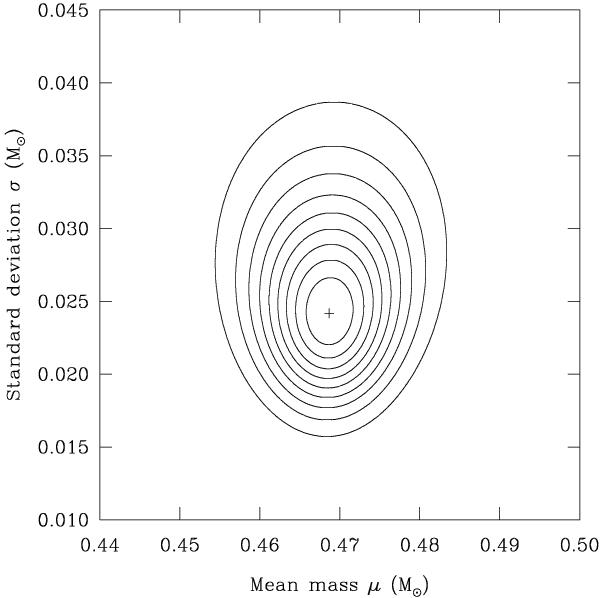
Likelihood surface for our extended sample of 22 stars illustrated in the form of a contour plot. The maximum of the likelihood function is indicated by a small cross and is arbitrarily normalized to 1. It is characterized by a mean mass of μ = 0.4687 M⊙ and a standard deviation of σ = 0.0242 M⊙. The contours have values of 0.9 (smallest loop), 0.8, 0.7, 0.6, 0.5, 0.4, 0.3, 0.2, and 0.1 (largest loop).
Current usage metrics show cumulative count of Article Views (full-text article views including HTML views, PDF and ePub downloads, according to the available data) and Abstracts Views on Vision4Press platform.
Data correspond to usage on the plateform after 2015. The current usage metrics is available 48-96 hours after online publication and is updated daily on week days.
Initial download of the metrics may take a while.