Fig. 1
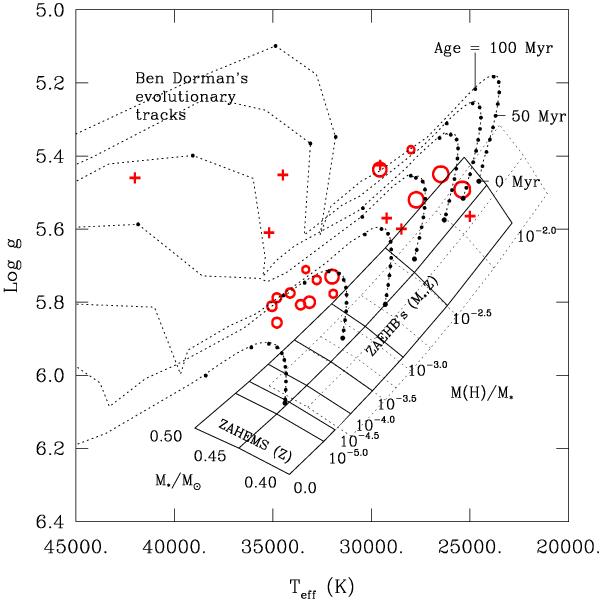
Distribution of sample stars in the log g − Teff diagram. The 15 pulsators are represented by open circles. The size of a circle is a logarithmic measure of the fractional mass of the outer H-rich envelope in a given pulsator (the larger the circle, the more massive the hydrogen envelope). The small crosses give the locations of seven binary stars with masses derived from light curve modeling and spectroscopy. For comparison purposes, the solid (dotted) curves show a grid of zero age extended horizontal branches (ZAEHB’s) with zero (solar) metallicity defined by 3 values of the total mass and 8 values of the mass of the H envelope (from Fontaine et al. 2006). Typical evolutionary tracks for sdB stars (from Charpinet et al. 2002b) are also shown; the small dots indicate time steps of 107 yr from the initial ZAEHB position of a model at time t = 0.
Current usage metrics show cumulative count of Article Views (full-text article views including HTML views, PDF and ePub downloads, according to the available data) and Abstracts Views on Vision4Press platform.
Data correspond to usage on the plateform after 2015. The current usage metrics is available 48-96 hours after online publication and is updated daily on week days.
Initial download of the metrics may take a while.