Free Access
Fig. 3
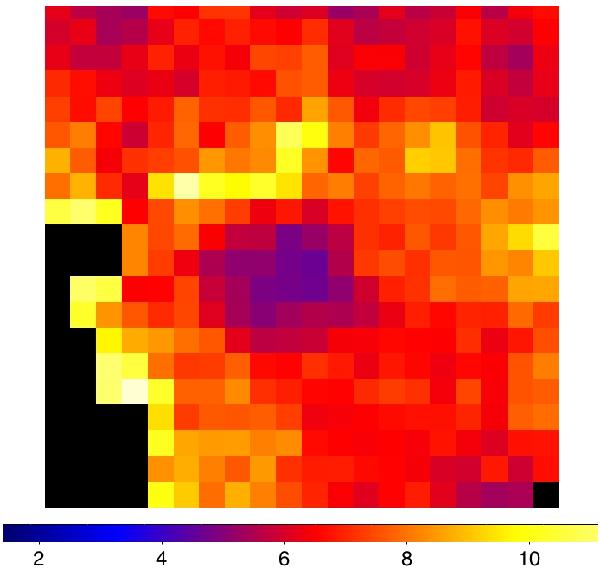
Temperature map obtained in a square region 40″ × 40″ centered on the cluster. The colorbar indicates the temperature scale in keV. Pixels where the 1 sigma error is larger than 50% are masked in black. See text for details.
Current usage metrics show cumulative count of Article Views (full-text article views including HTML views, PDF and ePub downloads, according to the available data) and Abstracts Views on Vision4Press platform.
Data correspond to usage on the plateform after 2015. The current usage metrics is available 48-96 hours after online publication and is updated daily on week days.
Initial download of the metrics may take a while.