Fig. 8
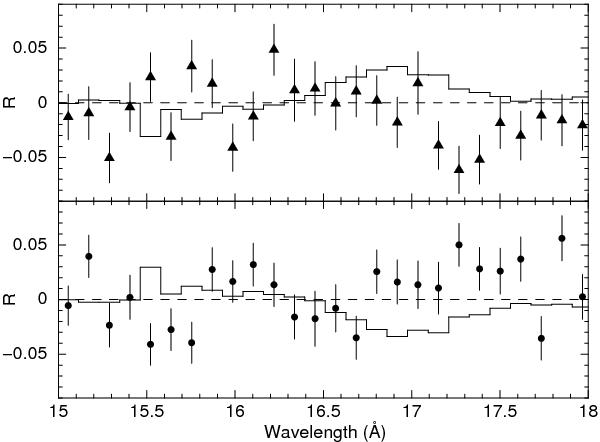
Scaled flux ratios compared to the time-average spectrum (Eqs. (2), (3)) for RGS. Upper panel: data and model for spectrum 5; Lower panel: same for the combined spectra 1 and 2. The data have been rebinned by another factor of two to 0.116 Å for clarity of display. The models are for component C only. For comparison with other figures, the band that is plotted corresponds to 0.69–0.83 keV.
Current usage metrics show cumulative count of Article Views (full-text article views including HTML views, PDF and ePub downloads, according to the available data) and Abstracts Views on Vision4Press platform.
Data correspond to usage on the plateform after 2015. The current usage metrics is available 48-96 hours after online publication and is updated daily on week days.
Initial download of the metrics may take a while.