Fig. 7
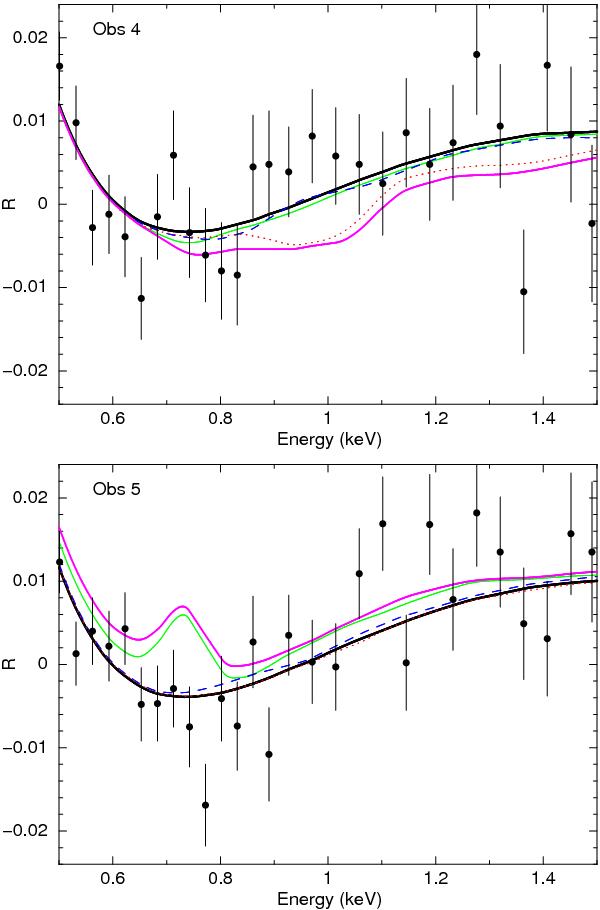
Example of continuum adjustment for spectra 4 (top panel) and 5 (bottom panel). Data points with error bars: observed ratio of spectra 4 and 5 to the average spectrum in the representation of Eq. (2), same as in Fig. 6. Solid black line: cubic polynomial fit to R over the 0.4–3.2 keV band as described in the text. Solid green line: predicted R in the representation of Eq. (3) for component C, but added here to the continuum approximation given by the black line; dashed blue line: same for component D; dotted red line: same for component E; thick magenta line: components A–E combined.
Current usage metrics show cumulative count of Article Views (full-text article views including HTML views, PDF and ePub downloads, according to the available data) and Abstracts Views on Vision4Press platform.
Data correspond to usage on the plateform after 2015. The current usage metrics is available 48-96 hours after online publication and is updated daily on week days.
Initial download of the metrics may take a while.