Fig. 4
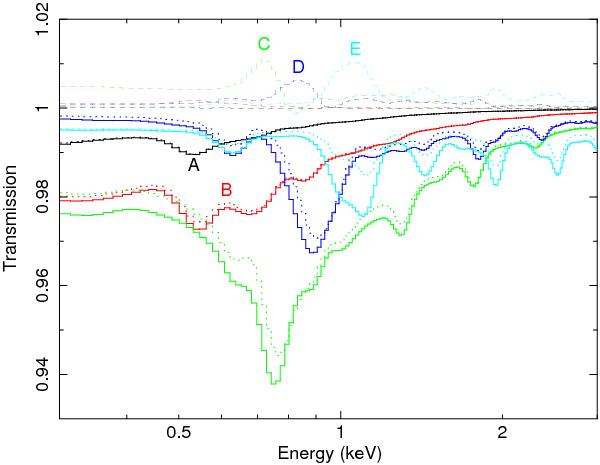
Transmission for the five ionisation components A–E at the resolution of the pn instrument (solid lines). Dotted lines: the same but for log ξ0.1 dex higher. Dashed lines: ratios of the transmission for the higher of the above ionisation states to the lower ionisation states. We use the same colour coding for each component.
Current usage metrics show cumulative count of Article Views (full-text article views including HTML views, PDF and ePub downloads, according to the available data) and Abstracts Views on Vision4Press platform.
Data correspond to usage on the plateform after 2015. The current usage metrics is available 48-96 hours after online publication and is updated daily on week days.
Initial download of the metrics may take a while.