Fig. 13
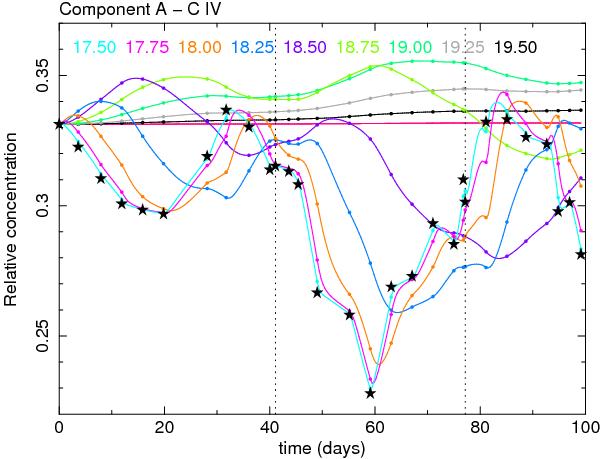
Time evolution of the C iv concentration of component A, relative to the total carbon concentration. Stars: a model with instantaneous response to continuum variations. Coloured lines: predictions for absorbing material at different distances as indicated by the number near the top of the plot; these numbers represent the log of the distance in m. The XMM-Newton observations were taken between the two vertical dotted lines.
Current usage metrics show cumulative count of Article Views (full-text article views including HTML views, PDF and ePub downloads, according to the available data) and Abstracts Views on Vision4Press platform.
Data correspond to usage on the plateform after 2015. The current usage metrics is available 48-96 hours after online publication and is updated daily on week days.
Initial download of the metrics may take a while.