Fig. 1
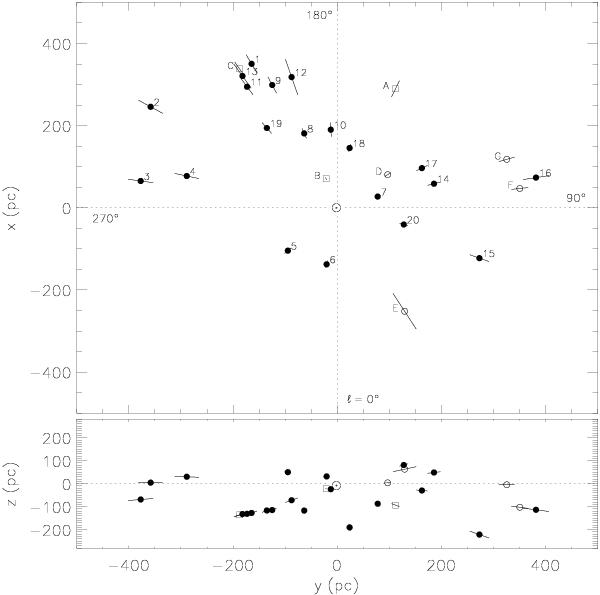
Distribution of the sample stars in the solar neighbourhood. Upper panel: galactic plane projection, the Galactic centre lies in direction of the bottom of the panel. Lower panel: rotational plane projection, the Northern Galactic Pole lies in direction of the top of the panel. The sample stars that are analysed quantitatively here are marked by dots, open boxes mark candidate SB2 systems and open circles stars that were excluded from the analysis because of other peculiarities. Numbers/letters correspond to those of our internal numbering in the tables. Error bars are of spectroscopic distances (stars 1–20, see Table 5) and of measured parallaxes (objects A–G). The position of the Sun is marked by ⊙ .
Current usage metrics show cumulative count of Article Views (full-text article views including HTML views, PDF and ePub downloads, according to the available data) and Abstracts Views on Vision4Press platform.
Data correspond to usage on the plateform after 2015. The current usage metrics is available 48-96 hours after online publication and is updated daily on week days.
Initial download of the metrics may take a while.