Fig. 4
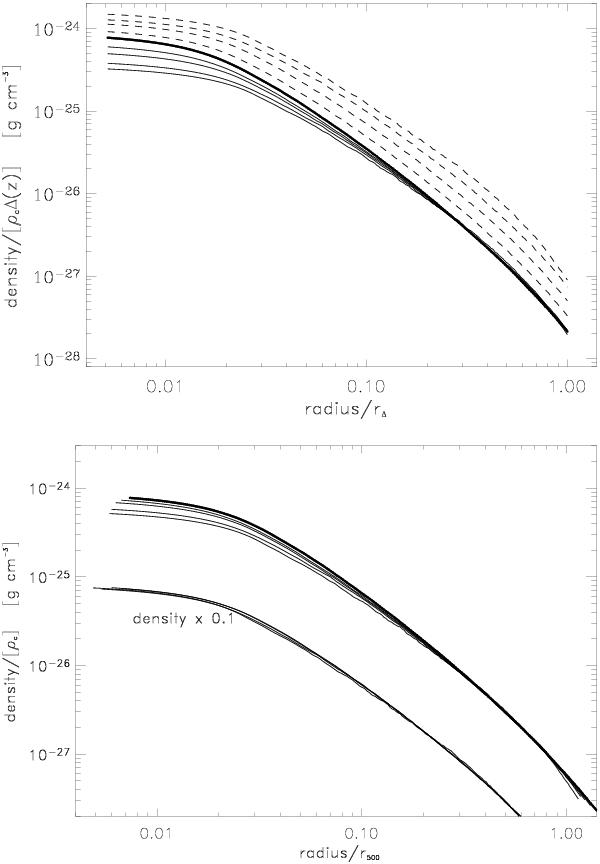
Upper panel: testing the redshift evolution of the self-similar scaling of the dark matter density distribution with the variable overdensity scaling model. The density profiles are given for redshifts of z = 0 (heavy line) and z = 0.2521, 0.5073, 0.7695, 1.0013. Dashed lines show the unscaled and solid lines the scaled profiles. Lower panel: redshift evolution of the self-similar scaling of the dark matter density distribution with the fixed overdensity scaling model. This model clearly is better than the model shown above. We also show, displaced by a factor of 0.1, the density profiles after applying the full scaling corrections described in Sect. 5. Apart from some numerical fluctuations we observe a perfect fit of the scaling corrections.
Current usage metrics show cumulative count of Article Views (full-text article views including HTML views, PDF and ePub downloads, according to the available data) and Abstracts Views on Vision4Press platform.
Data correspond to usage on the plateform after 2015. The current usage metrics is available 48-96 hours after online publication and is updated daily on week days.
Initial download of the metrics may take a while.