Fig. 1
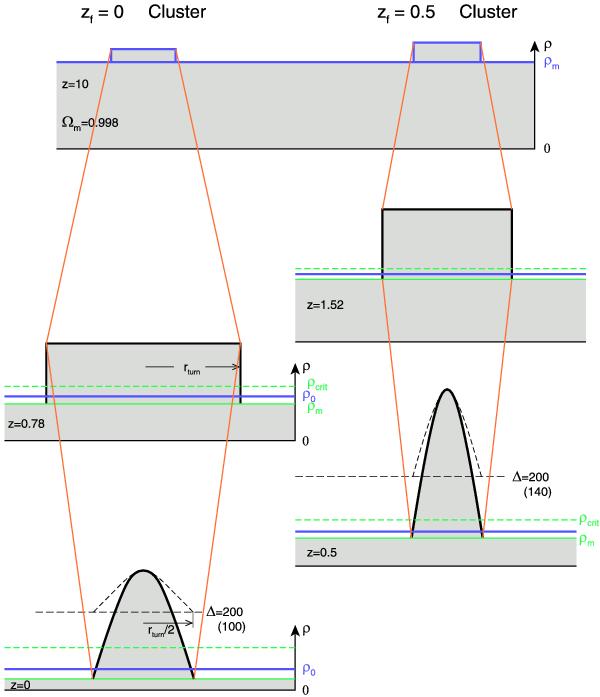
Schematic illustration of how the galaxy cluster structure scaling depends on the formation epoch of the cluster and on the critical density of the universe in an Einstein-de Sitter (densities are blue) and in a concordance cosmological model (green). The left panel provides a sketch of cluster collapse for a cluster with a formation redshift of z = 0, and the right panel shows a cluster forming at z = 0.5. For further explanations see the text.
Current usage metrics show cumulative count of Article Views (full-text article views including HTML views, PDF and ePub downloads, according to the available data) and Abstracts Views on Vision4Press platform.
Data correspond to usage on the plateform after 2015. The current usage metrics is available 48-96 hours after online publication and is updated daily on week days.
Initial download of the metrics may take a while.