Fig. 9
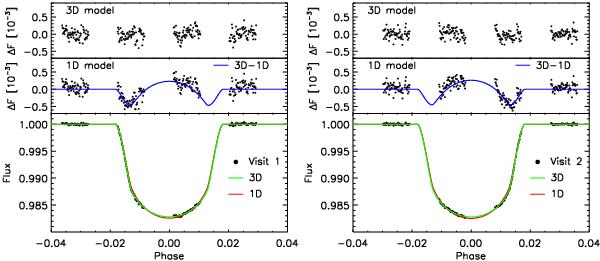
Transit light curve fits for two visits of HD 209458b (dots in the lower panels of each plot), integrated over the wavelength range between 2900 Å and 5700 Å with limb darkening coefficients derived from the 3D model (green lines) and the 1D MARCS model (red lines); see Table 4 for the fit parameters. The residuals of the 3D fits and the 1D fits are shown in the upper panels and center panels in each plot, the blue lines show the deviation between the 3D and 1D model light curves.
Current usage metrics show cumulative count of Article Views (full-text article views including HTML views, PDF and ePub downloads, according to the available data) and Abstracts Views on Vision4Press platform.
Data correspond to usage on the plateform after 2015. The current usage metrics is available 48-96 hours after online publication and is updated daily on week days.
Initial download of the metrics may take a while.