Free Access
Fig. 8
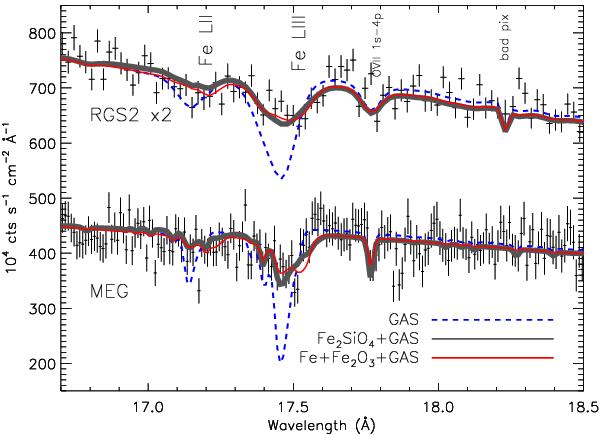
Detail of the iron L edge region. Here for clarity we display only the MEG and a displaced RGS2 data set. The best fit (solid line, see Table 5) is compared with pure gas fit with solar abundances (dotted line) and with a mixture of gas and iron-rich olivine (thick solid light line).
Current usage metrics show cumulative count of Article Views (full-text article views including HTML views, PDF and ePub downloads, according to the available data) and Abstracts Views on Vision4Press platform.
Data correspond to usage on the plateform after 2015. The current usage metrics is available 48-96 hours after online publication and is updated daily on week days.
Initial download of the metrics may take a while.