Fig. 9
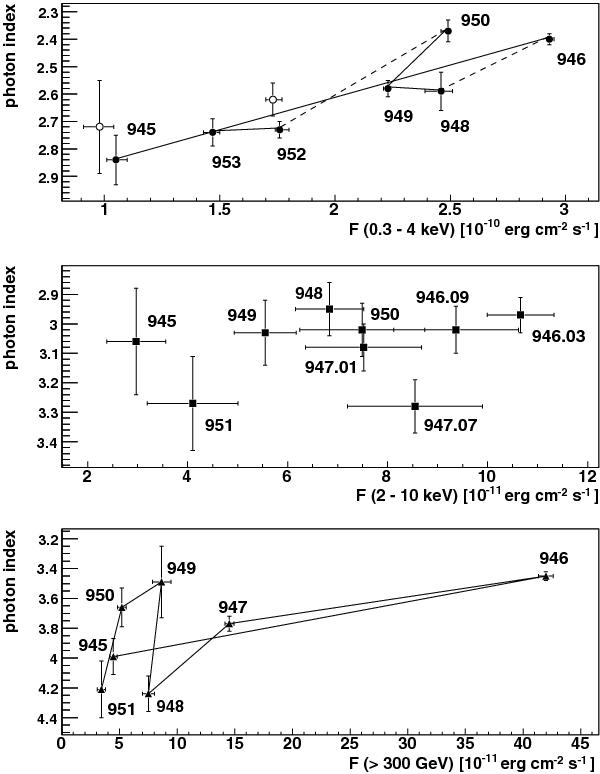
Variation of the photon index with the integrated flux. The upper panel shows the variation in the soft band of the Swift XRT data, the middle panel in the RXTE data, and the lower panel in the H.E.S.S. data. Labels indicate the date in MJD-53 000. The XRT points marked with filled circles show the photon index below the break for nights where a broken power law yields the best result and the photon index for a simple power law for the remaining nights. For MJD 53 945 and 53 952, solutions for the XRT adopting an ad hoc break at 1 keV are shown with open circles. For more details, see Table A.3. The H.E.S.S. point with the label “951” refers to an average over data taken from MJD 53 951 to 53 953.
Current usage metrics show cumulative count of Article Views (full-text article views including HTML views, PDF and ePub downloads, according to the available data) and Abstracts Views on Vision4Press platform.
Data correspond to usage on the plateform after 2015. The current usage metrics is available 48-96 hours after online publication and is updated daily on week days.
Initial download of the metrics may take a while.