Fig. 6
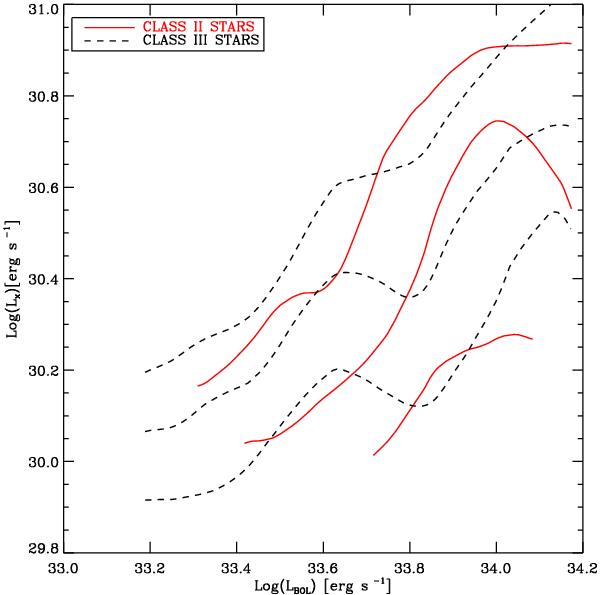
X-ray luminosity distribution as a function of the stellar bolometric luminosity. The three couples of lines refer to the (25%, 50%, 75%) quartiles of the LX distributions calculated in running intervals of LBOL constituted by 80 contiguous points and smoothed in intervals of bolometric luminosity of 0.1 erg s-1. The continuous lines refer to Class II stars, the dashed ones to Class III stars. The quartiles have been plotted just where the fraction of upper limit values does not affect the calculation of the quartile itself.
Current usage metrics show cumulative count of Article Views (full-text article views including HTML views, PDF and ePub downloads, according to the available data) and Abstracts Views on Vision4Press platform.
Data correspond to usage on the plateform after 2015. The current usage metrics is available 48-96 hours after online publication and is updated daily on week days.
Initial download of the metrics may take a while.