Fig. 3
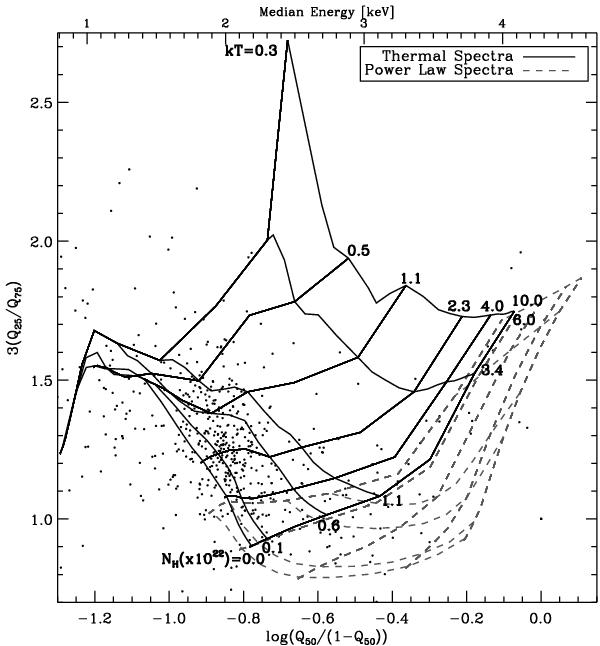
Quantiles of X-ray spectra. The dots indicate the quantities derived from source energy quantiles. The two grids show the same quantities derived from simulated spectra. The solid line grid refers to thermal spectra with NH = [1020,1021,0.6 × 1022,1.1 × 1022,3.4 × 1022,6 × 1022] cm-2 and kT = [0.3,0.5,1.1,2.3,4.0,10.0] keV, and the dashed line grid to simulated power-law spectra typical of AGN, with the same NH values and power-law indices Γ = [0.0,0.4,1.0,1.6,2.0] .
Current usage metrics show cumulative count of Article Views (full-text article views including HTML views, PDF and ePub downloads, according to the available data) and Abstracts Views on Vision4Press platform.
Data correspond to usage on the plateform after 2015. The current usage metrics is available 48-96 hours after online publication and is updated daily on week days.
Initial download of the metrics may take a while.