Fig. 2
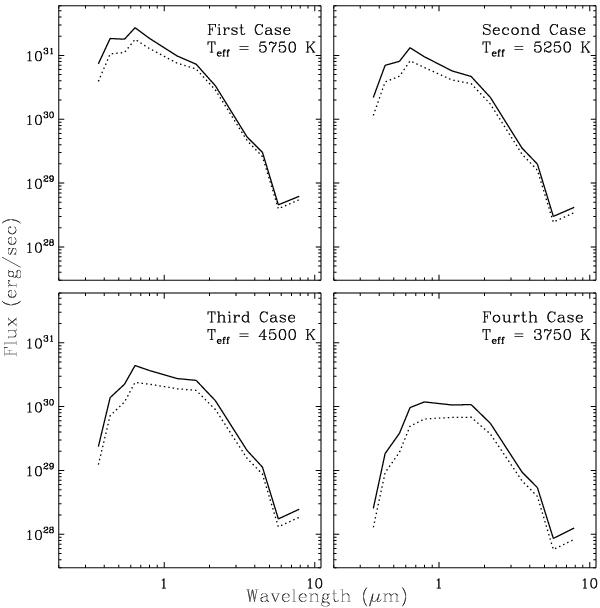
Flux vs. wavelength for all the cases in Table 1. Solid lines plot the spectral distributions of the stellar unperturbed photospheres and dotted lines the spectral distributions of the star + spot systems with f0 = 0.5. In the top left we present the first case, in the top right the second case, in the bottom left the third case, and in the bottom right the fourth case.
Current usage metrics show cumulative count of Article Views (full-text article views including HTML views, PDF and ePub downloads, according to the available data) and Abstracts Views on Vision4Press platform.
Data correspond to usage on the plateform after 2015. The current usage metrics is available 48-96 hours after online publication and is updated daily on week days.
Initial download of the metrics may take a while.