Fig. 7
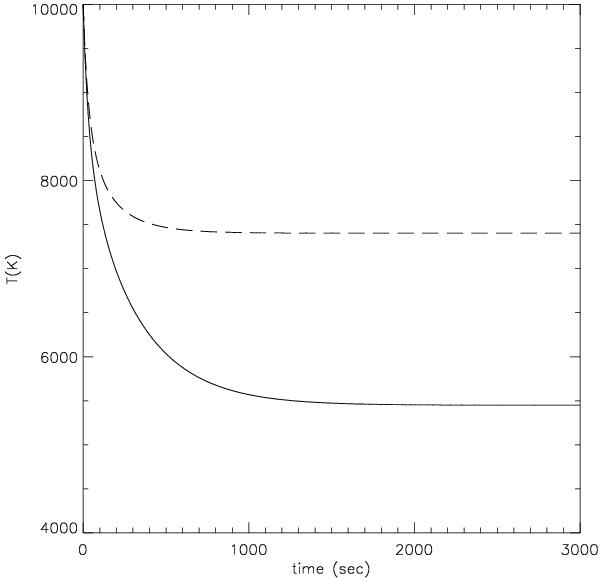
Radiative relaxation of the slab-center temperature is shown for the reference model. Full line corresponds to hydrogen-calcium mixture, dashed one is for pure hydrogen plasma. Both cases are treated in PRD and are therefore consistent with the results in Table 1 (note that the dashed line can be compared with the corresponding plot in Gouttebroze 2007, the differences are due to geometry and PRD/CRD). In both cases, the relaxation starts from an isothermal slab model with T = 10 000 K.
Current usage metrics show cumulative count of Article Views (full-text article views including HTML views, PDF and ePub downloads, according to the available data) and Abstracts Views on Vision4Press platform.
Data correspond to usage on the plateform after 2015. The current usage metrics is available 48-96 hours after online publication and is updated daily on week days.
Initial download of the metrics may take a while.