Fig. 3
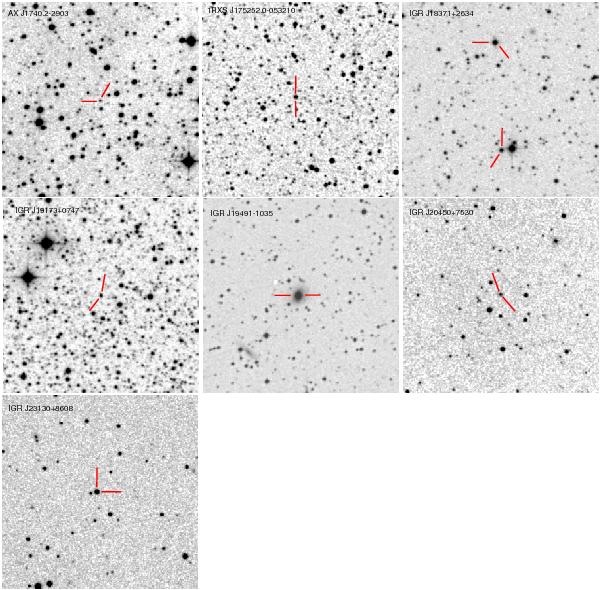
As Fig. 1, but for 7 more INTEGRAL sources of our sample (see Table 1). The image of the field of IGR J20450+7530 (centre right panel) has been extracted from the DSS-II-Infrared survey, whereas the one of IGR J18371+2634 (upper right panel) shows the optical counterparts of both X-ray objects reported in Landi et al. (2011, see also Sect. 4.3 of the present work).
Current usage metrics show cumulative count of Article Views (full-text article views including HTML views, PDF and ePub downloads, according to the available data) and Abstracts Views on Vision4Press platform.
Data correspond to usage on the plateform after 2015. The current usage metrics is available 48-96 hours after online publication and is updated daily on week days.
Initial download of the metrics may take a while.