Fig. 8
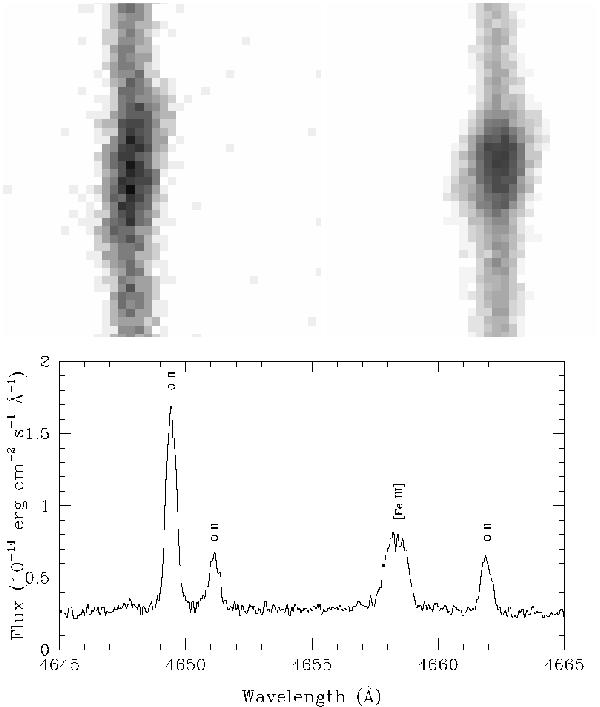
Upper panel: portion of the 2D echellogram showing [Fe iii] λ5270 (left) and [Cl iii] λ5517 lines for M1-61. The grey scale is the same for both lines. It is clear that the [Fe iii] emission is more extended that [Cl iii] emission. Lower panel: portion of the 1D extracted spectra showing the [Fe iii] λ4658 line, compared with multiplet 1 O ii ORLs. The FWHM of the [Fe iii] line is clearly larger.
Current usage metrics show cumulative count of Article Views (full-text article views including HTML views, PDF and ePub downloads, according to the available data) and Abstracts Views on Vision4Press platform.
Data correspond to usage on the plateform after 2015. The current usage metrics is available 48-96 hours after online publication and is updated daily on week days.
Initial download of the metrics may take a while.