Fig. 7
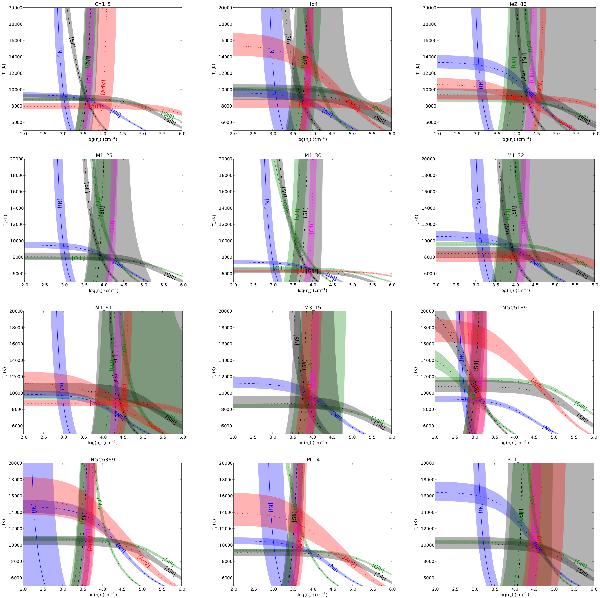
Te − ne diagnostic plots. Colors correspond to species: grey for S, blue for N, green for O, magenta for Cl, and red for Ar. Different lines indicate ions: solid for neutral ions ([N i]), dashed for once ionized ions ([N ii], [S ii] and [S ii]), dotted for two ionized ions ([O iii], [S iii], [Ar iii], and [Cl iii]), and dotted-dashed for three times ionized ions ([Ar iv]).
Current usage metrics show cumulative count of Article Views (full-text article views including HTML views, PDF and ePub downloads, according to the available data) and Abstracts Views on Vision4Press platform.
Data correspond to usage on the plateform after 2015. The current usage metrics is available 48-96 hours after online publication and is updated daily on week days.
Initial download of the metrics may take a while.