Fig. 6
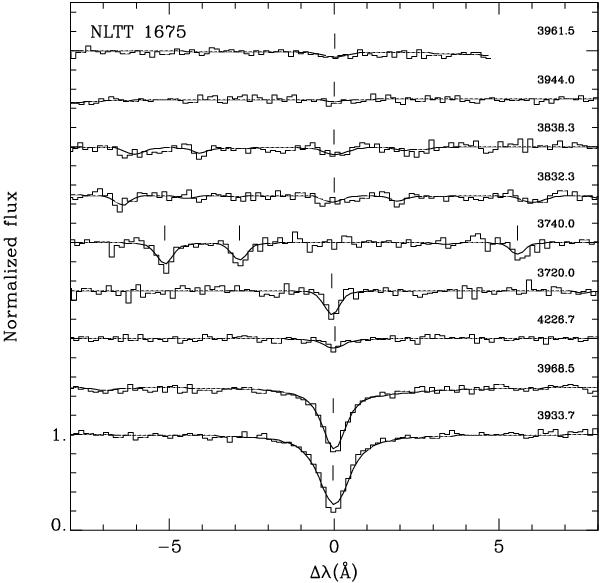
X-shooter spectra of NLTT 1675 compared to the best fit model. The wavelength scale is centred on the values indicated on the right. The top two spectra show the weak Al i lines, followed by spectra showing Mg i lines around 3838 Å and 3832 Å and Fe i lines around 3740 Å and 3720 Å. Finally, the bottom three spectra show the Ca i and Ca ii lines.
Current usage metrics show cumulative count of Article Views (full-text article views including HTML views, PDF and ePub downloads, according to the available data) and Abstracts Views on Vision4Press platform.
Data correspond to usage on the plateform after 2015. The current usage metrics is available 48-96 hours after online publication and is updated daily on week days.
Initial download of the metrics may take a while.