Fig. A.1
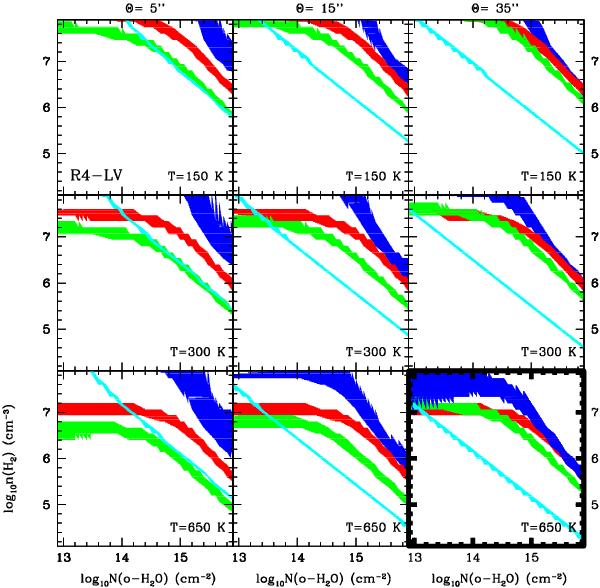
Diagnostic diagram to explore the parameter (Tkin, nH2, Northo−H2O, Θ) space that fits the observed data of the R4-LV component. The different panels are for three different values of the emission size (Θ = 5′′, 15′′ and 35′′) and three different temperatures (T = 150, 300 and 650 K). Three line ratios are reported in each panel: 557 GHz/1097 GHz (green), 1670 GHz/1097 GHz (blue) and 1113 GHz/1097 GHz (red); and the integrated intensity of the 1097 GHz line (cyan). An error of 10% is assumed for each line intensity. The thick boxes in this diagram and in all following diagrams mark the range of parameters for which all line ratios and line intensity intersect, corresponding to the physical conditions that are consistent with the observed data.
Current usage metrics show cumulative count of Article Views (full-text article views including HTML views, PDF and ePub downloads, according to the available data) and Abstracts Views on Vision4Press platform.
Data correspond to usage on the plateform after 2015. The current usage metrics is available 48-96 hours after online publication and is updated daily on week days.
Initial download of the metrics may take a while.