Fig. 5
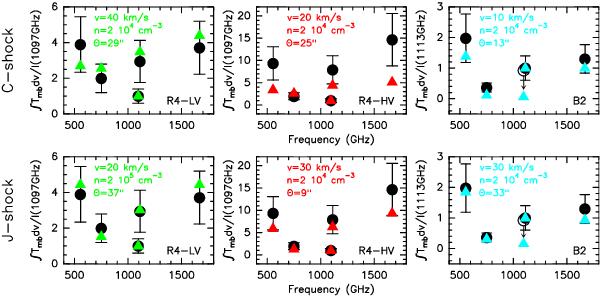
Comparison between the observed line ratios (circles) of the H2O lines and the corresponding line ratios predicted (triangles) by the best-fit C-type shock (top) and the J-type shock (bottom) models. For each type of shock (C- and J-), the model that best reproduces our observed line ratios is presented and the corresponding shock velocity, pre-shock density and emission size are marked. The line ratios are normalized to the 1097 GHz line for R4-LV (left) and R4-HV (middle) and to the 1113 GHz line for B2 (right). For B2, the detected lines are shown as black filled circles, while the black open circle represents the upper limit of the non-detected H2O line at 1097 GHz (assuming a 3σ upper limit and a line width of 50 km s-1).
Current usage metrics show cumulative count of Article Views (full-text article views including HTML views, PDF and ePub downloads, according to the available data) and Abstracts Views on Vision4Press platform.
Data correspond to usage on the plateform after 2015. The current usage metrics is available 48-96 hours after online publication and is updated daily on week days.
Initial download of the metrics may take a while.