Fig. 3
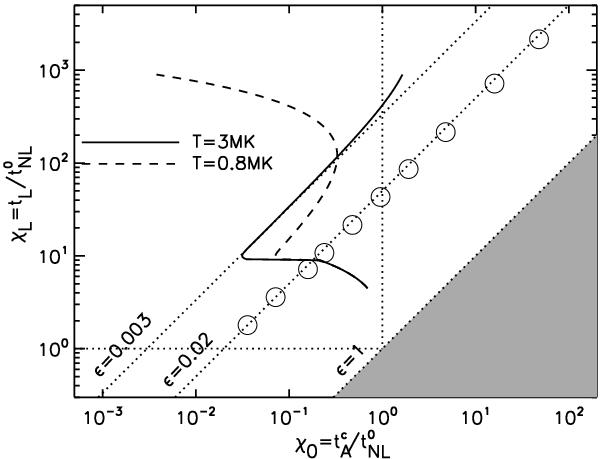
Characteristics of typical solar loops compared with simulation parameters:
χL versus
χ0. The turnover time is fixed to
 s and we assume a
two-temperature hydrostatic loop model (see appendix). The black solid and dashed
lines are for the two coronal temperatures of 3 MK and 0.8 MK, respectively. The
circles are for the three-layer runs A − L (see
Table 1). The diagonal dotted lines are the
curve
χL = (1/ϵ)χ0
for three values of ϵ.
s and we assume a
two-temperature hydrostatic loop model (see appendix). The black solid and dashed
lines are for the two coronal temperatures of 3 MK and 0.8 MK, respectively. The
circles are for the three-layer runs A − L (see
Table 1). The diagonal dotted lines are the
curve
χL = (1/ϵ)χ0
for three values of ϵ.
Current usage metrics show cumulative count of Article Views (full-text article views including HTML views, PDF and ePub downloads, according to the available data) and Abstracts Views on Vision4Press platform.
Data correspond to usage on the plateform after 2015. The current usage metrics is available 48-96 hours after online publication and is updated daily on week days.
Initial download of the metrics may take a while.