Fig. A.1
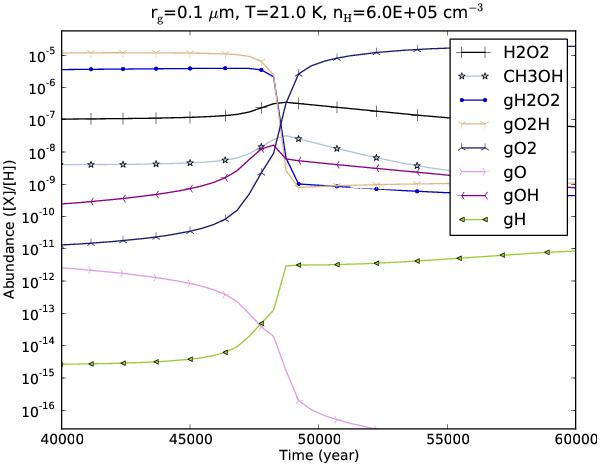
A zoom-in plot of Fig. 1 (with several species removed and several added), focusing on the spike-like feature (though nothing looks like a spike anymore). The abundance of gH has been multiplied by a factor of 1012 (to make the plot look more compact).
Current usage metrics show cumulative count of Article Views (full-text article views including HTML views, PDF and ePub downloads, according to the available data) and Abstracts Views on Vision4Press platform.
Data correspond to usage on the plateform after 2015. The current usage metrics is available 48-96 hours after online publication and is updated daily on week days.
Initial download of the metrics may take a while.