Fig. 20
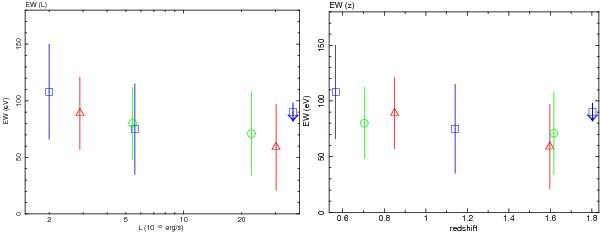
Dependence of unresolved 6.4 keV Fe line equivalent width on the average luminosity (left) and the average redshift (right) of the subsamples (first row of Table 3). Squares: L − z subsamples; circles: redshift subsamples; triangles: luminosity subsamples. We represent upper limits by a down-pointing arrow. Each set of points with the same symbol are statistically independent, but not between the symbols.
Current usage metrics show cumulative count of Article Views (full-text article views including HTML views, PDF and ePub downloads, according to the available data) and Abstracts Views on Vision4Press platform.
Data correspond to usage on the plateform after 2015. The current usage metrics is available 48-96 hours after online publication and is updated daily on week days.
Initial download of the metrics may take a while.