Free Access
Fig. 5
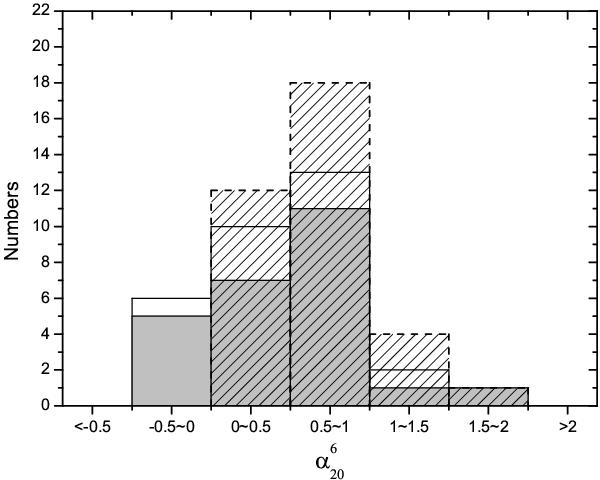
The distributions of the spectral index between 6 cm and 20 cm for the nearby Seyfert sample without detected maser emission and its subsample of Seyfert 2s (shaded regions). For comparison, the distribution of Seyfert 2s with maser detections is also presented (areas filled with diagonal lines).
Current usage metrics show cumulative count of Article Views (full-text article views including HTML views, PDF and ePub downloads, according to the available data) and Abstracts Views on Vision4Press platform.
Data correspond to usage on the plateform after 2015. The current usage metrics is available 48-96 hours after online publication and is updated daily on week days.
Initial download of the metrics may take a while.