Fig. 4
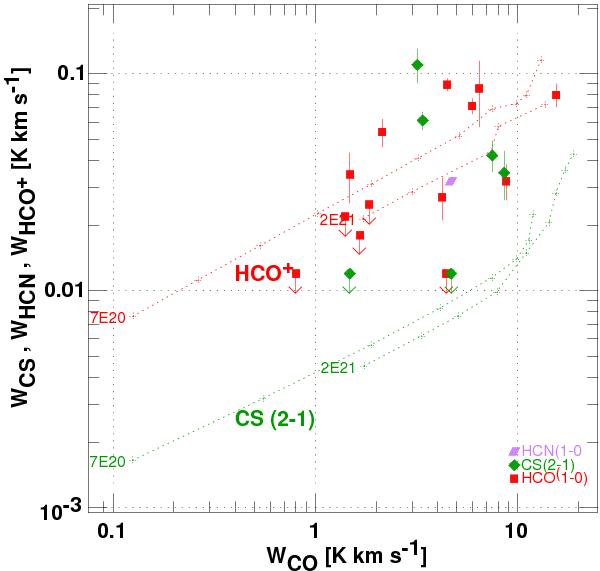
Integrated emission line brightnesses for HCO+J = 1−0 (red boxes), CS J = 2−1 (green diamonds) and HCN J = 1−0 (magenta parallelogram) observed in diffuse gas, plotted against the integrated brightness of CO J = 1−0. Data sources are given in Sects. 4.1–4.3. Chained red and green curves are model results as discussed in Sect. 4.4. For both HCO+ (red) and CS (green), calculations are shown for clouds with N(H) = 0.7 and 2.0 × 1021 cm-2 with number density n(H) increasing from 128 cm-3 at left in marked steps of 21/2. X(HCO+) = X(CS) = 2 × 10⁻⁹ was assumed; the CS brightness increases linearly with increased abundance X(CS) at fixed WCO while that of HCO+ declines very slightly, as discussed in Sect. 4.4 of the text.
Current usage metrics show cumulative count of Article Views (full-text article views including HTML views, PDF and ePub downloads, according to the available data) and Abstracts Views on Vision4Press platform.
Data correspond to usage on the plateform after 2015. The current usage metrics is available 48-96 hours after online publication and is updated daily on week days.
Initial download of the metrics may take a while.