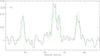
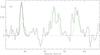
Fig. 10
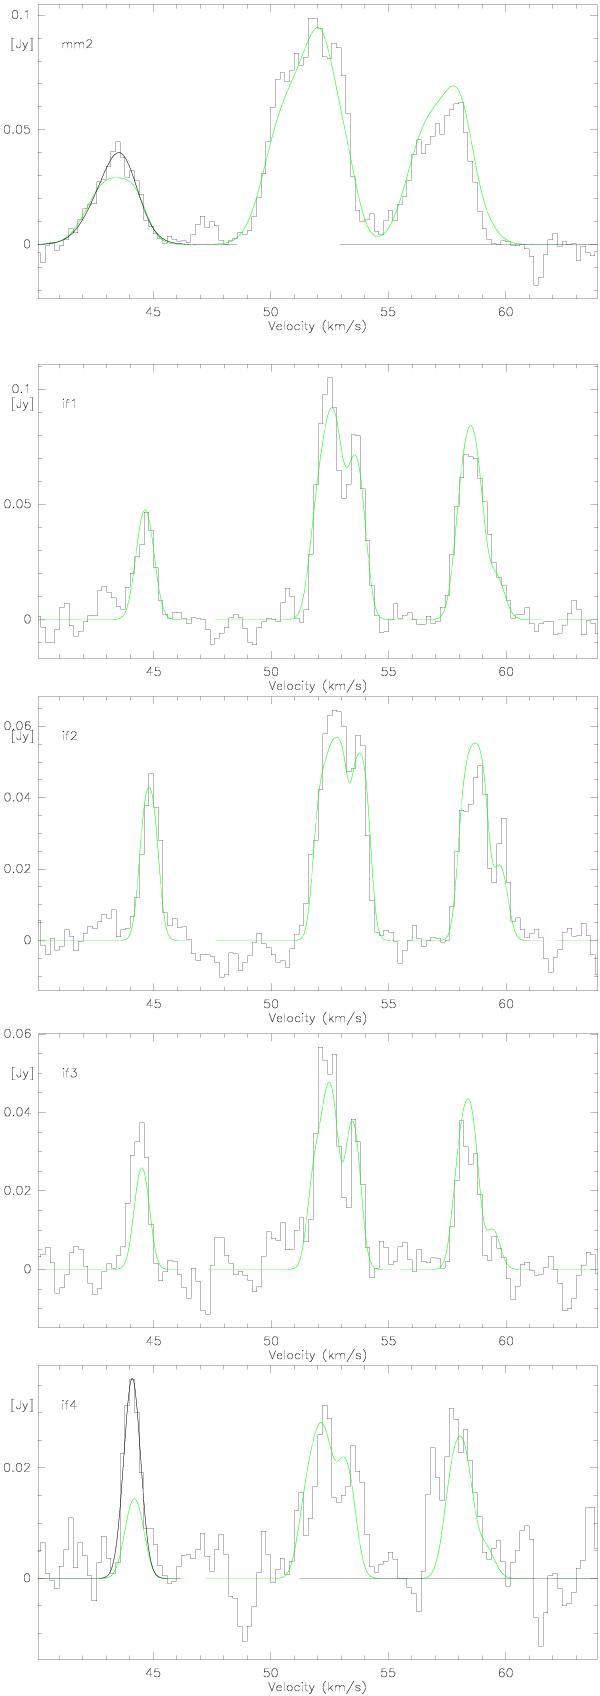
N2H+(1−0) spectra around 50 km s-1 toward mm2 and the four interface positions if1 to if4. The green lines show N2H+ fits taking into account the whole hyperfine structure whereas the black lines show two- and one-component Gaussian fits to the isolated hyperfine structure line −8.0 km s-1 from the central peak. Peak velocities and line widths the hyperfine structure fits if1 to if3 and of the Gaussian fits (corrected for the −8.0 km s-1 offset) for mm2 and if4 are presented in Table 3.
Current usage metrics show cumulative count of Article Views (full-text article views including HTML views, PDF and ePub downloads, according to the available data) and Abstracts Views on Vision4Press platform.
Data correspond to usage on the plateform after 2015. The current usage metrics is available 48-96 hours after online publication and is updated daily on week days.
Initial download of the metrics may take a while.