Free Access
Fig. 8
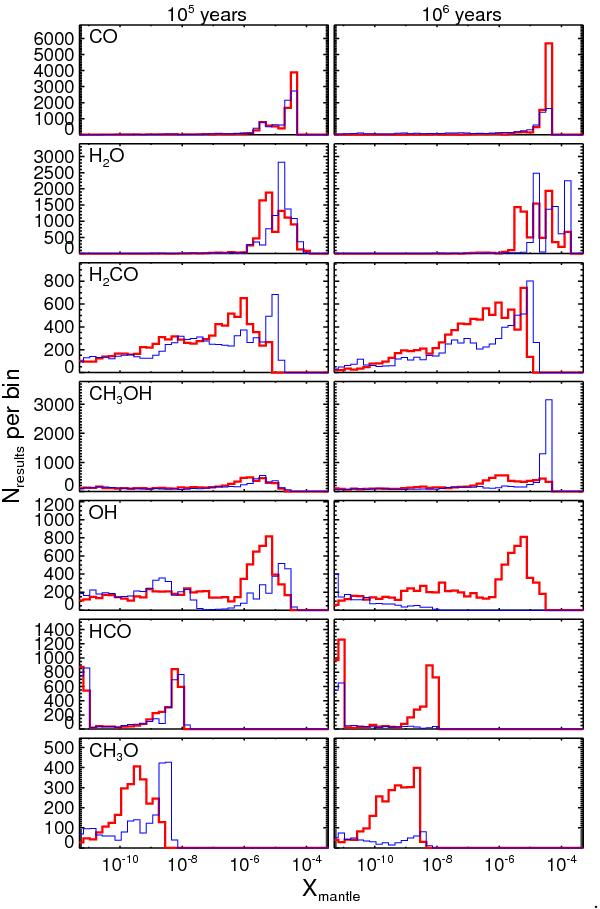
Distribution of the predicted mantle abundance Xmantle of the key species at 105 (left panels) and 106 yr (right panels). The thin blue and thick red lines refer to the bulk and multilayer approach. The distribution has been built by considering all the ~18 000 runs of the grid (Sect. 3.8).
Current usage metrics show cumulative count of Article Views (full-text article views including HTML views, PDF and ePub downloads, according to the available data) and Abstracts Views on Vision4Press platform.
Data correspond to usage on the plateform after 2015. The current usage metrics is available 48-96 hours after online publication and is updated daily on week days.
Initial download of the metrics may take a while.