Fig. 1
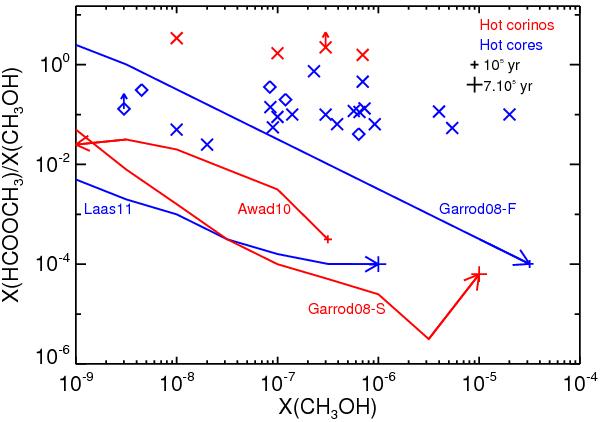
Gas phase methyl formate to methanol abundance ratio as function of the gas phase abundance of methanol. Observations of hot corinos with single-dish telescopes are represented by red crosses: NGC 1333-4A by Bottinelli et al. (2004), IRAS16293 by Cazaux et al. (2003), NGC 1333-2A and –4B by Bottinelli et al. (2007). Observations of hot cores with single-dish telescopes are represented by blue crosses: G34.3+0.15 by Mehringer & Snyder (1996), SgrB2(N) and SgrB2(M) by Nummelin et al. (2000), G327.3-0.6 by Gibb et al. (2000), OMC1 by Sutton et al. (1995), G34.3+0.2, SgrB2(N), DR23(OH), W51, Orion Hot-Core by Ikeda et al. (2001), AFGL2591, G24.78, G75.78, NGC 6334, NGC 7538, W3(H2O), W33A by Bisschop et al. (2007). Observations of hot cores with interferometers are represented by blue diamonds: G34.3+0.15 by MacDonald et al. (1996), G19.61-0.23 by Qin et al. (2010), Orion KL, G29.96 by Beuther et al. (2009), and G47.47+0.05 by Remijan et al. (2004). The red curves report the predictions of the methyl formate to methanol abundance ratio appropriate to the hot corinos case by Garrod et al. (2008, their Fig. 6) and Awad et al. (2010, their Fig. 5). The blue curves report the predictions appropriate to the hot cores case by Garrod et al. (2008, their Fig. 4) and Laas et al. (2011, their Fig. 5). The arrows represent the direction of the time in each model and the ticks refer to timescales.
Current usage metrics show cumulative count of Article Views (full-text article views including HTML views, PDF and ePub downloads, according to the available data) and Abstracts Views on Vision4Press platform.
Data correspond to usage on the plateform after 2015. The current usage metrics is available 48-96 hours after online publication and is updated daily on week days.
Initial download of the metrics may take a while.