Free Access
Fig. 2
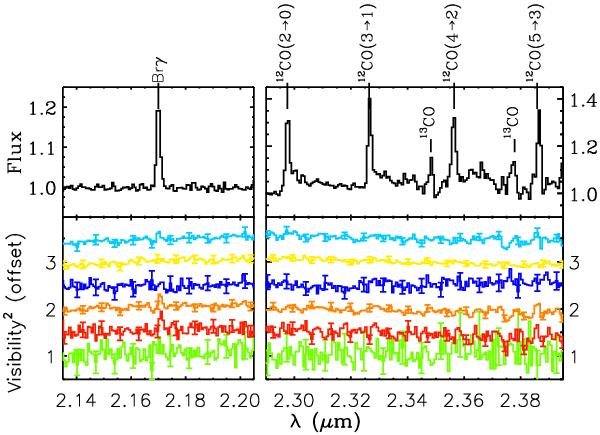
The average spectrum and differential visibilities of HD 327083. The upper panel presents the spectrum featuring Brγ and CO emission. The visibilities are shown offset (by an integer times 0.5) to aid comparison. They are shown to scale in Fig. 3.
Current usage metrics show cumulative count of Article Views (full-text article views including HTML views, PDF and ePub downloads, according to the available data) and Abstracts Views on Vision4Press platform.
Data correspond to usage on the plateform after 2015. The current usage metrics is available 48-96 hours after online publication and is updated daily on week days.
Initial download of the metrics may take a while.