Fig. 3
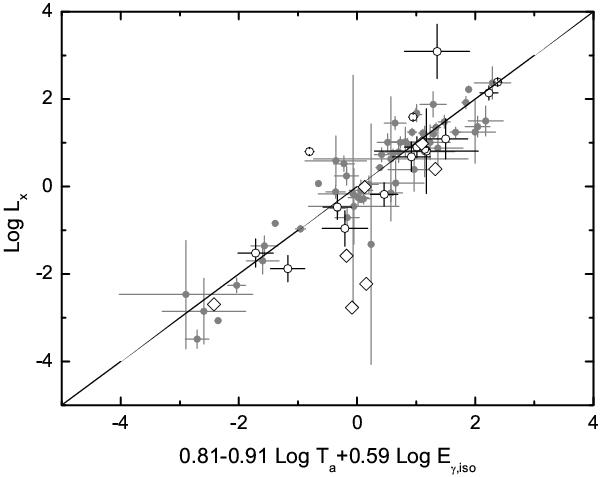
The best-fit correlation between LX, Ta and Eγ,iso for all the 77 GRBs of D2010. The units of all physical quantity are the same as Fig. 2. The X-axis is a combined quantity of 0.81−0.91log Ta + 0.59log Eγ,iso. The filled points correspond to the observed data of 55 “golden” GRBs with error bars. The hollow diamonds correspond to 7 GRBs with too large error bars to be plotted in the figure, and the hollow circles correspond to other 15 discarded events. The solid line is the best fit for all the 77 data points.
Current usage metrics show cumulative count of Article Views (full-text article views including HTML views, PDF and ePub downloads, according to the available data) and Abstracts Views on Vision4Press platform.
Data correspond to usage on the plateform after 2015. The current usage metrics is available 48-96 hours after online publication and is updated daily on week days.
Initial download of the metrics may take a while.