Fig. 1
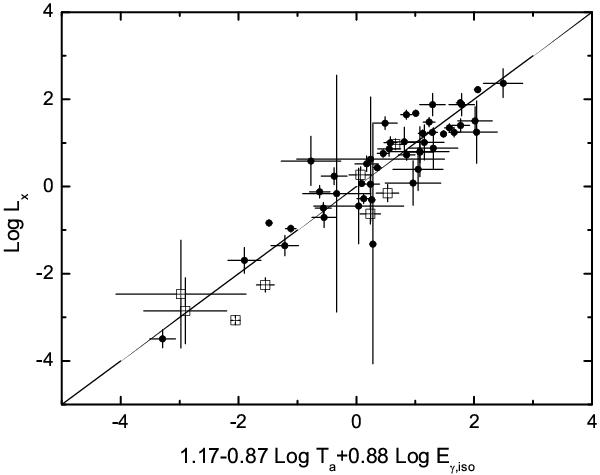
The best-fit correlation between LX, Ta, and Eγ,iso for our “golden sample”. Y-axis is the X-ray luminosity at the end time of the plateau phase, i.e. LX, in units of 1047 erg/s. The X-axis is a combined quantity of Ta (in units of 103 s) and Eγ,iso (in units of 1053 erg), i.e. 1.17 − 0.87log Ta + 0.88log Eγ,iso. The filled points correspond to the observed data of 47 long GRBs and the hollow square points correspond to the eight intermediate-class GRBs. The solid line is plotted from Eq. (7), which is the best fit of the 55 observational data points.
Current usage metrics show cumulative count of Article Views (full-text article views including HTML views, PDF and ePub downloads, according to the available data) and Abstracts Views on Vision4Press platform.
Data correspond to usage on the plateform after 2015. The current usage metrics is available 48-96 hours after online publication and is updated daily on week days.
Initial download of the metrics may take a while.