| Issue |
A&A
Volume 538, February 2012
|
|
|---|---|---|
| Article Number | A145 | |
| Number of page(s) | 9 | |
| Section | Planets and planetary systems | |
| DOI | https://doi.org/10.1051/0004-6361/201117681 | |
| Published online | 16 February 2012 | |
Transiting exoplanets from the CoRoT space mission⋆
XX. CoRoT-20b: A very high density, high eccentricity transiting giant planet
1 Laboratoire d’Astrophysique de Marseille, 38 rue Frédéric Joliot-Curie, 13388 Marseille Cedex 13, France
e-mail: This email address is being protected from spambots. You need JavaScript enabled to view it.
2 IAG, Universidade de São Paulo, Brazil
3 Institute of Planetary Research, German Aerospace Center, Rutherfordstrasse 2, 12489 Berlin, Germany
4 Observatoire de Haute Provence, 04670 Saint Michel l’Observatoire, France
5 Institut d’Astrophysique de Paris, 98bis boulevard Arago, 75014 Paris, France
6 Observatoire de la Côte d’ Azur, Laboratoire Cassiopée, BP 4229, 06304 Nice Cedex 4, France
7 Department of Physics, Denys Wilkinson Building Keble Road, Oxford, OX1 3RH, UK
8 Observatoire de l’Université de Genève, 51 chemin des Maillettes, 1290 Sauverny, Switzerland
9 LESIA, Obs de Paris, Place J. Janssen, 92195 Meudon Cedex, France
10 Institut d’astrophysique spatiale, Université Paris-Sud 11 & CNRS (UMR 8617), Bât. 121, 91405 Orsay, France
11 Department of Physics and Astronomy, Aarhus University, 8000 Aarhus C, Denmark
12 Research and Scientific Support Department, ESTEC/ESA, PO Box 299, 2200 AG Noordwijk, The Netherlands
13 Instituto de Astrofisica de Canarias, 38205 La Laguna, Tenerife, Spain
14 Universidad de La Laguna, Dept. de Astrofísica, 38200 La Laguna, Tenerife, Spain
15 University of Vienna, Institute of Astronomy, Türkenschanzstr. 17, 1180 Vienna, Austria
16 University of Liège, Allée du 6 août 17, Sart Tilman, Liège 1, Belgium
17 Thüringer Landessternwarte, Sternwarte 5, Tautenburg 5, 07778 Tautenburg, Germany
18 Space Research Institute, Austrian Academy of Science, Schmiedlstr. 6, 8042 Graz, Austria
19 School of Physics and Astronomy, Raymond and Beverly Sackler Faculty of Exact Sciences, Tel Aviv University, Tel Aviv, Israel
20 Wise Observatory, Tel Aviv University, Tel Aviv 69978, Israel
21 LUTH, Observatoire de Paris, CNRS, Université Paris Diderot ; 5 place Jules Janssen, 92195 Meudon, France
Received: 11 July 2011
Accepted: 27 September 2011
Abstract
We report the discovery by the CoRoT space mission of a new giant planet, CoRoT-20b. The planet has a mass of 4.24 ± 0.23 MJup and a radius of 0.84 ± 0.04 RJup. With a mean density of 8.87 ± 1.10 g cm-3, it is among the most compact planets known so far. Evolutionary models for the planet suggest a mass of heavy elements of the order of 800 M⊕ if embedded in a central core, requiring a revision either of the planet formation models or both planet evolution and structure models. We note however that smaller amounts of heavy elements are expected by more realistic models in which they are mixed throughout the envelope. The planet orbits a G-type star with an orbital period of 9.24 days and an eccentricity of 0.56.The star’s projected rotational velocity is vsini = 4.5 ± 1.0 km s-1, corresponding to a spin period of 11.5 ± 3.1 days if its axis of rotation is perpendicular to the orbital plane. In the framework of Darwinian theories and neglecting stellar magnetic breaking, we calculate the tidal evolution of the system and show that CoRoT-20b is presently one of the very few Darwin-stable planets that is evolving toward a triple synchronous state with equality of the orbital, planetary and stellar spin periods.
Key words: planetary systems / stars: fundamental parameters / techniques: photometric / techniques: radial velocities / techniques: spectroscopic
The CoRoT space mission, launched on December 27th 2006, has been developed and is operated by CNES, with the contribution of Austria, Belgium, Brazil, ESA (RSSD and Science Programme), Germany, and Spain.
© ESO, 2012
1. Introduction
The existence of a planet population at very short orbital distance of a star, typically a < 0.1 AU, with its wide range of orbital and physical properties is an intriguing phenomenon. In-situ formation of these massive bodies so close to their host star at a location where the circumstellar material is depleted and warm, indeed appears highly unlikely. Planet migration from further away distances where solid material is abundant, triggered by gravitational interactions, is invoked to account for this population. The exact process responsible remains unclear but two major mechanisms have been proposed: gradual planet migration caused by interaction with the circumstellar gas disk (Lin et al. 1996; Papaloizou et al. 2007) or planet-planet or planet-companion star interactions combined with tidal dissipation (e.g., Rasio & Ford 1996; Fabrycky & Tremaine 2007; Nagasawa et al. 2008). Regardless of the exact nature of the formation path, these planets have undergone significant orbital evolution since the time of their formation. Their current properties provide in valuable constraints to help our understanding of their orbital evolution, especially the planet’s orbital eccentricity and the spin-orbit alignment of the system.
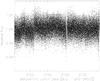 |
Fig. 1 The 24.278-day long CoRoT-20 reduced light curve at a constant 512-s time sampling. |
Until now, transit surveys have been more sensitive to planets of a very short orbital period. The situation improved thanks to the extended temporal coverage of ground-based transit surveys and the advent of space missions, CoRoT (Baglin et al. 2009; Deleuil et al. 2011) and Kepler (Borucki et al. 2010). As a consequence, the number of planets with orbital periods longer than a few days has significantly increased over the past two years. While the mean eccentricity of the close-in planets is close to zero, the transiting giant planets at greater orbital distance have a much wider range of eccentricity, a picture more consistent with the sample of planets found by radial velocity surveys. These trends imply that there is a third-body-induced migration with tidal circularization of an initial eccentric and possibly high-obliquity orbit (e.g., Winn et al. 2010; Matsumura et al. 2010; Pont et al. 2011). A consequence of this orbital evolution is the tidal destruction of the planet, which spirals down onto the star in the lifetime of the system (Gonzalez 1997; Jackson et al. 2009), a dramatic destruction that appears to be the fate of the vast majority of the transiting planets (Matsumura et al. 2010).
In this paper, we report the discovery of CoRoT-20b, a new member of the hot-Jupiter class population. The planet transits its G-type parent star every 9.24 days, along an orbit with a high eccentricity. The CoRoT observations are presented in Sect. 2. The accompanying follow-up observations and their results are described in Sects. 3 and 5 for the host star analysis. The final system parameters are derived in Sect. 4. We then discuss the properties of this new planet in Sect. 6. We investigate its orbital evolution and fate but also its internal structure that raises new questions about the nature of such a compact object.
2. CoRoT-20b light curve
The planet was discovered in one of the fields observed by the CoRoT satellite (Baglin et al. 2009; Deleuil et al. 2011) in the so-called anti-center direction. This field, labeled SRa03, was monitored for 24.278 days starting on 1 March 2010. As a consequence of the DPU1 break down that took place in March 2009, the number of targets actually photometrically monitored by the instrument was reduced to a maximum of 6000 stars only. The released telemetry is used to oversample a much larger number of targets than initially possible, up to magnitude ≃15. While not among the brightest stars of the field (Table 1), CoRoT-20 could be studied more effectively thanks to this new opportunity and its observation was performed with the regular 32 s time sampling. It was also bright enough to allow for three-color photometry. Two transits were detected in its light curve by the Alarm mode pipeline (Surace et al. 2008). The target was flagged as a good planetary candidate and placed among the highest priorities for follow-up observations.
CoRoT-20b IDs, coordinates, and magnitudes.
The light curve of CoRoT-20b is displayed in Fig. 1. It shows a star rather quiet photometrically speaking, with no special prominent features. Three transits are clearly visible with a period of 9.24 days and a depth slightly shallower than 1%. For the detailed analysis, we used the light curve produced by the CoRoT calibration pipeline. It corrects for the main instrumental effects such as the CCD zero offset and gain, the background light, and the spacecraft jitter (see Auvergne et al. 2009). Portions of the light curve that were flagged by the pipeline as affected by particle impacts during the South Atlantic Anomaly crossing, were removed and ignored in the analysis. In total, the light curve consists of 56 869 photometric measurements and has a corresponding duty cycle of 88%.
3. Follow-up observations
A photometric time-series of the star was obtained at the Wise observatory on November 14, 2010 to check whether an unknown nearby eclipsing binary could be the source of the transits (Deeg et al. 2009). The detection of a transit ingress excluded this configuration at the spatial resolution of Wise. The observed time of the ingress, with first contact at 2 455 515.510 ± 0.007 HJD was then used to refine the period of CoRoT-20b, toward the value quoted in Table 3. Ground-based images from both Wise and the DSS show that the star is rather isolated (Fig. 2). This supports the very low contamination rate that was derived for the star within the CoRoT photometric mask (see Sect. 4).
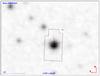 |
Fig. 2 Image of the DSS showing CoRoT-20 and its environment. The photometric mask used for CoRoT observations is overplotted on the target. |
Radial velocity (RV) observations started during the same season on December 9, 2010. We used the HARPS spectrograph (Mayor et al. 2003) mounted on the 3.6-m ESO telescope (Chile) as part of the ESO large program 184.C-0639, the SOPHIE spectrograph (Perruchot et al. 2008) on the 1.93-m telescope at the Observatoire de Haute Provence (France) and the FIES spectrograph on the Nordic Optical Telescope (Frandsen & Lindberg 1999) based on the 2.56-m Nordic Optical telescope in La Palma (Spain) under observing program P42-216.
Log of radial velocity observations.
We used the same instrument set-up as for previous CoRoT candidates follow-up: high resolution mode for HARPS and high efficiency mode for SOPHIE without acquisition of the simultaneous thorium-argon calibration, the second fiber being used to monitor the Moon background light (Santerne et al. 2011). For HARPS and SOPHIE, the exposure time was set to one hour. We reduced data and computed RVs with the pipeline based on the weighted cross-correlation function (CCF) using a numerical G2 mask (Baranne et al. 1996; Pepe et al. 2002).
The FIES observations were performed in high-resolution mode with the 1.3 arcsec fiber yielding a resolving power R ≈ 67 000 and a spectral coverage from 3600 to 7400 Å. Three consecutive exposures of 1200 s were obtained for each observation. Long-exposed ThAr spectra were acquired right before and after each science spectra set, as described in Buchhave et al. (2010). Standard IRAF routines were used to reduce, combine, and wavelength calibrate the nightly spectra. The RV measurements were derived by cross-correlating the science spectra with the spectrum of the RV standard star HD 50692 (Udry et al. 1999), observed with the same instrument set-up as CoRoT-20.
The 15 radial velocities of CoRoT-20b are listed in Table 2 and displayed in Fig. 3. They present a clear variation, in phase with the CoRoT ephemeris and consistent with a companion in the planet-mass regime with an eccentric orbit. Nevertheless, we investigated the possibility that an unresolved eclipsing binary was the source of observed transits. We performed the line-bisector analysis of the CCFs (see Fig. 4) and also verified that there is no dependence of the RV variations on the cross-correlation masks constructed for different spectral types (Bouchy et al. 2009).
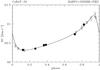 |
Fig. 3 The phase-folded radial velocity measurements of CoRoT-20. The various symbols correspond to the different spectrographs used for the follow-up campaign: HARPS (black circle), SOPHIE (open circle) and FIES (open triangle). The best-fit solution is overplotted in full line. |
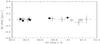 |
Fig. 4 Bisector span versus radial velocity of CoRoT-20 showing no correlation. |
The Keplerian fit of the RVs was performed simultaneously with the transit modeling (see Sect. 4). All the parameters of the fit are listed in Table 3.
Planet and star parameters.
4. System parameters
We calculated the flux contamination from nearby stars whose light might fall inside the CoRoT photometric mask using the same methodology as described in Bordé et al. (2010). The method takes into account the photometric mask used to perform the on-board photometry and all the stars in the target neighborhood, including faint background stars. We found that the contamination is less than 0.6% and we further neglected it.
Three sections of the light curve, each centered on a transit, were locally normalized by fitting a third-degree polynomial. Each section was a five-hour interval before the transit ingress and after its egress. The detailed physical modeling of the system was performed by carrying out the transit modeling and the Keplerian fit of the radial velocity measurements simultaneously. For the transit fit, we used the formalism of Giménez (2006, 2009). The fit involves twelve free parameters: the orbital period P, the transit epoch Ttr, the transit duration T14, the ratio of the planet to stellar radii Rp/R⋆, the inclination i between the orbital plane and the plane of the sky, the Lagrangian orbital elements h = e sinω and k = e cosω, where e is the eccentricity and ω the argument of the periastron, the radial velocity semi-amplitude K, the systemic velocity γrel and the two offsets between SOPHIE and HARPS radial velocities and SOPHIE and FIES. For the transit modeling, we used a limb-darkening quadratic law (Claret 2003, 2004). The limb-darkening coefficients ua and ub were taken using the tabulated values for the CoRoT bandpass from Sing (2010) for the atmospheric parameters Teff, log g, and metallicity derived for the central star (see Sect. 5): ua = 0.4262 ± 0.0168 and ub = 0.2434 ± 0.0108). The two corresponding non-linear limb-darkening coefficients are u+ = ua + ub = 0.6696 ± 0.0201 and u− = ua − ub = 0.1828 ± 0.0201. We decided to keep these limb-darkening parameter values fixed in the transit fitting.
The fit was performed using the algorithm AMOEBA (Press et al. 1992). The initial values of the fitted parameters were changed using a Monte Carlo method to find the global minimum of the χ2. The associated 1-σ errors were then estimated using a bootstrap procedure described in details in Bouchy et al. (2011). In such a procedure, the limb-darkening parameters were allowed to vary within their error bars related to the atmospheric parameter uncertainties. The final values of the fitted parameters and the subsequently derived system parameters are given in Table 3. Figure 5 displays the best fit and the observed folded transit.
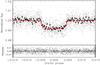 |
Fig. 5 The phase-folded transit in the phase space. The phase bins are 3.3 min and the error bar in each individual bin was calculated as the dispersion of the points inside the bin, divided by the square root of the number of points per bin. The best model is overplotted as a full line. |
5. Stellar parameters
The spectroscopic analysis was performed in a way similar to that for all CoRoT planets: a master spectrum was created from the co-addition of spectra collected for the radial velocity measurements of the companion. We chose the HARPS spectra that have the highest spectral resolution. We selected those that were unaffected by the Moon reflected light at the time of the observations. Each order of the selected spectra was corrected by the blaze, set in the barycentric rest frame and rebinned to the same wavelength grid with a constant step of 0.01 Å. The spectra were then co-added order per order. Each order of the co-added spectrum was then carefully normalized and the overlapping orders were merged resulting in a single one-dimensional spectrum. This master spectrum has a signal-to-noise ratio of 176 per element of resolution at 5760 Å in the continuum.
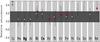 |
Fig. 6 Abundances of the chemical elements measured with VWA in the HARPS coadded spectrum of CoRoT-20. The abundances refer to the solar value. White circles correspond to neutral lines, red boxes to singly ionized lines, and the yellow area represents the mean metallicity within 1-σ error bar. |
A prior estimate of the atmospheric parameters Teff, log g, chemical composition, and vsini was performed by fitting the spectrum with a library of synthetic spectra calculated using MARCS stellar atmosphere models, including the Hα Balmer line. The rotational broadening was estimated for a selection of isolated spectral lines fitted by synthetic spectra convolved with various rotational velocities. We found that vsini = 4.5 ± 1.0 km s-1 and vmacro = 3.5 ± 1.0 km s-1. The detailed analysis was then carried out using the versatile wavelength analysis package (VWA) (Bruntt et al. 2004, 2010b). A first set of weak and isolated lines of Fe i and Fe ii was fitted until the derived abundances of Fe minimized the correlation with the equivalent width and the excitation potentials. We found that Teff = 5880 ± 90 K, log g = 4.05 ± 0.17 and vmic = 1.10 ± 0.1 km s-1, which corresponds to a G2-type dwarf. The abundances of other elements for which we could find isolated spectral lines were then derived (see Fig. 6). We performed an independent estimate of the surface gravity from the pressure-sensitive lines: the Mg i1b lines, the Na i D doublet, and the Ca i at 6122 Å and 6262 Å. We fitted the spectrum with the aforementioned grid of synthetic spectra in regions centered on each of the spectral lines of interest. The inferred value of the surface gravity is log g = 4.2 ± 0.15, a value in good agreement with the log g derived with VWA obtained from the agreement between the Fe i and Fe ii abundances. We thus adopted log g= 4.2 for the surface gravity.
The mean metallicity of the star was computed to be the mean of metals with more than ten lines in the spectrum, such as Si, Ca, Ti, Fe, and Ni (Fig. 6). This yields a straight mean of [M/H] = 0.14 ± 0.05. The error in [M/H] caused by the uncertainty in Teff, log g, and microturbulence is 0.11 dex, which we must add quadratically to get [M/H] = 0.14 ± 0.12 (Bruntt et al. 2010a).
We also searched for any indicators of age. We found no hint of stellar activity in the Ca ii H and K lines. However, the Li i line is clearly detected at 6708 Å (see Fig. 7). We measured an equivalent width of Weq = 44 mÅ and determined a lithium abundance of 2.97. Following Sestito & Randich (2005), this leads to an age in the range from 100 Myr to 1 Gyr, depending on the star’s initial rotation velocity.
The modeling of the star in the HR diagram was carried out in the (Teff,  ) plane taking the host star’s metallicity into account. This resulted in the final estimates of the star’s fundamental parameters given in Table 3 of M ⋆ = 1.14 ± 0.08 M⊙ and R⋆ = 1.02 ± 0.05 R⊙. The inferred surface gravity is log g = 4.47 ± 0.11, in agreement within the errors with the spectroscopic result. The evolutionary status points to a young star likely in the last stages of the pre-MS phase. We found that the most likely isochrone age is 100
 Myr, a result in good agreement with the Li abundance.
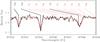 |
Fig. 7 CoRoT-20 spectrum in a spectral region around the Li i lines at 6708 Å. |
We calculated the distance to the star. We used the parameters of the star that we had derived and its 2-MASS magnitudes to estimate the reddening. We found a color excess E(J − K) = 0.18 mag and the absorption AV = 1.04 ± 0.5 mag using the extinction law of Schlegel et al. (1998). This yields a distance of 1.23 ± 0.12 kpc, consistent with the strong interstellar absorption observed in the Na i (D1) and (D2) lines.
6. CoRoT-20 system properties
Compared to the sample of known transiting planets, CoRoT-20b is unusual in many respects. With an orbital period of 9.24 days, it joins the group of transiting planets with periods outside the pile-up at 3 days. It is the fifth planet discovered by CoRoT in this period domain, which currently accounts for 25 planets, 9 of which belong to the multi-planet systems: Kepler-9 (Holman et al. 2010), Kepler-10 (Fressin et al. 2011), and Kepler-11 (Lissauer et al. 2011). However, all these Kepler-planets have a mass that is less than ~0.3 MJup and could not be directly compared to the giant planet population. Excluding these planets in multiple systems, for the 17 remaining objects of the sample that do not have a detected companion, 8, that is 47%, have a significant eccentric orbit with e in the range from 0.15 to 0.9.
Planets with highly eccentric orbits appear to be found preferentially among the high-mass and/or long-period planet population. With a mass of 4.13 MJup, which places it at the border of the gap in mass between the regular hot-Jupiter population and the very massive planet one, CoRoT-20b is consistent with this trend. In the mass-period diagram, these planets are clearly separated from the lighter planets with circular orbits (Pont et al. 2011). This dichotomy and in particular the lack of massive close-in planets on circular orbits suggest that tidal evolution should play an important role in the fate of the planet population.
6.1. Tidal evolution
Following the approach of Levrard et al. (2009), we checked the stability of CoRoT-20b to tidal dissipation. The authors calculated the ratio of the total angular momentum of a given system Ltot to the critical angular momentum Lcrit for some transiting systems. According to Hut (1980), tidal equilibrium states exist when the total angular momentum is larger than this critical value Lcrit. However, this equilibrium state might be either stable or unstable, depending on whether the orbital angular momentum Lorb is more than three times the total spin angular momentum Lspin, or not. Levrard et al. (2009) demonstrated that for none of the systems apart from HAT-P-2b the stable tidal equilibrium state, which corresponds to Ltot/Lcrit > 1, exists. In addition, the fate of these close-in planets is ultimately a collision with their host star. The study was recently reexamined and extended to more than 60 transiting systems by Matsumura et al. (2010) who reached a similar conclusion, implying that the vast majority of these close-in planets will spiral-in to their host star and be destroyed by tides. Using Eqs. (1) and (2) given by Levrard et al. (2009) that neglect any effect of a possible magnetized stellar wind, we found for CoRoT-20b that
 This shows that, within the current observational uncertainties, the planet has a tidal equilibrium state. We note that our approach also assumes that there is a small value of the stellar obliquity, which is poorly constrained as the star’s rotation period could not be derived from the light curve. We simply assumed that the rotation axis is perpendicular to the line of sight and derived the star’s rotation period from the values of the vsini (Table 3), which is a regular method for transiting systems. This implies that the rotational period of the star is 11.5 ± 3.1 days, that is of the same order as the planet’s orbital period. In the case of CoRoT-20b, Lspin ⋆ /Lorb < 1/3 and most of the angular momentum of the system is in the orbit. According to Matsumura et al. (2010), CoRoT-20b belongs to the very small subgroup of Darwin-stable systems that evolve toward a stable tidal equilibrium state where migration will stop.
From the Roche limit separation, the planet thus lies well beyond two times the Roche limit distance. Using the relation from Faber et al. (2005):
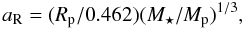 we found that the Roche limit aR of the system is 0.0057 AU, which supports the migration scenario over the scattering/Kozai-cycle scenario proposed by Ford & Rasio (2006).
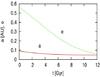 |
Fig. 8 Tidal evolution of the orbital semi-major axis and eccentricity. The figure is displayed on a time interval larger than the expected lifetime of the star to show the triple synchronization characteristic of a Darwin-stable system. |
We performed a complete calculation of the tidal evolution of the system formed by the star and the planet assuming a linear tidal model (Mignard 1979; Hut 1981). The main difficulty here is to choose the values of the dissipation in both the star and the planet. For the main semi-diurnal tides of the star, we adopted the value  as found for hot Jupiters (Hansen 2010; Benítez-Llambay et al. 2011). Owing to the close values of the orbital period and the rotation of the star, the components of the tides raised on the star by the planet that are related to the orbital eccentricity are also equally important, but the values of the current dissipation obtained are of the same order of magnitude. For the planet, we derived one value based on the actually determined Q′ of Jupiter (Q′ = 1.36 × 10⁵, see Lainey et al. 2009). We first note that standard linear tidal theories (see Hut 1981, Eq. (45)) allow us to determine the current rotation period (stationary) of the planet independently of the dissipation. We found 2.64 ± 0.13 days. To transform
  into the planet’s
  , we have to take into account that: (i) scales with the semi-diurnal tide period (see Ferraz-Mello et al. 2008; Matsumura et al. 2010); and (ii) scales with
  (see Eggleton et al. 1998; Ogilvie & Lin 2004). We found that
  . Figure 8 shows the variation in the semi-major axis and the evolution of the eccentricity. One can see that with the adopted dissipation values, while the eccentricity tends toward zero, circularization will not be achieved within the lifetime of the system.
Figure 9 shows the evolution of the periods. The planet rotation is currently in a stationary super-synchronous state, that is the planet rotation is faster than its orbital motion. Its period increases as the eccentricity decreases and synchronization is almost reached when the eccentricity becomes very small. The star rotation period is currently decreasing and will equal the synchronous value at some time 4 Gyr from now. However, it will continue to decrease until it reaches the triple synchronous stationary state. The triple synchronization, however, does not seem to be reachable within the lifetime of the star.
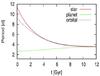 |
Fig. 9 Tidal evolution of the rotational and orbital periods. |
We note that the actual Q′ values are not known and the values we used are only estimates found in previous studies. Therefore, the exact timescale of the tidal processes is uncertain. Furthermore, by extracting angular momentum from the system, stellar magnetic braking may prevent the planet from reaching a triple synchronous state and ultimately jeopardize its survival (Bouchy et al. 2011). Simulations in which magnetic braking was active during the whole system lifetime, following the model proposed by Bouvier et al. (1997) and using the same tide parameters as in the examples given above, show that the planet will orbit to within the Roche limit in about 6 Gyr. This result depends critically on the adopted parameters and would required a detailed study that is well beyond the scope of the present paper.
We also investigate the consequences of the circularization of the planet orbit that is in the phase of rapid circularization, on the transits occurrence. Assuming there is no other close massive perturber in the system, two effects appear to cause TTVs: the decrease in the orbital semi-major axis and the circularization of the orbit. The time scale on which the orbital semi-major axis varies is ȧ = −0.95 × 10⁻⁵ 1/Myr presently (see Fig. 9). As a consequence, a continuous period variation of Ṗ/P ≈ − 4 × 10-12 per cycle is expected. As we know, this linear period variation will cause a parabolic O − C curve, and in 100 years from now the O − C value will be only − 25 s. This is slightly over the 3σ observation limit of CoRoT (Bean 2009; Csizmadia et al. 2010). Assuming that the transit timing precision can be forced down to 5 s in the future, this O − C value will be reached 45 years from now.
The evolution of the eccentricity during the circularization process has two consequences. First the occurrence of the secondary eclipse will change. The displacement D of the secondary from phase 0.5 is given by (e.g., Borkovits 2004, Eqs. (1) and (2)). The previous results of the tidal evolution calculations indicated that ė = −4.5 × 10⁻⁵ 1/Myr and Ṗ = −1.5 × 10⁻³ days/Myr. Assuming a constant ω, we have that Ḋ = −37.56 × 10⁻⁵ days/Myr or Ḋ = −9.53 × 10⁻¹² days/cycle. This variation is of the same order as the previous one caused by the decreasing semi-major axis, so should be also observable within a century.
For the second effect, that is the circularization of the orbit, one can also consider the occurrence of a small precession in the orbit. This effect is hardly observable, but interesting on the theoretical side, since the transit occurs at the true anomaly v = 90° − ω, where ω is the argument of periastrion. The latter is also subject to variations caused not only by relativistic effects but also by the tidal effects which force the apsidal line to rotate. However, this variation has a different time scale. We thus do not take this variation into account here, even if tidal forces also cause a small precession of the orbit showing that  is not zero. Hence, if e decreases due to circularization, and even if ω is constant, then at the epoch of transit the eccentric anomaly will increase and hence the mean anomaly at transit will occur later. However, a first estimation shows that this effect may be negligible on a ten year timescale.
6.2. Internal structure
The planet CoRoT-20b is a massive hot-Jupiter with a mass of 4.24 MJup a radius of 0.84 MJup, and an inferred density ρ = 8.87 ± 1.1 g cm-3. A few giant planets have been already reported that have a similar or even higher density. For example, CoRoT-14b ρ = 7.3 ± 1.5 g cm-3 (Tingley et al. 2011), WASP-18b ρ = 8.8 ± 0.9 (Hellier et al. 2009; Southworth 2010), or HAT-P-20b ρ = 13.78 ± 1.5 g cm-3 (Bakos et al. 2011). While the masses of these planets spans a large range, from 4 up to more than 9 MJup, their radius is close to 1 RJup. Given CoRoT-20b’s high planetary mass, its small size is surprising. Among these high density giants planets, only HAT-P-20b is of comparable size, i.e. 0.867 ± 0.033 RJup. The planet CoRoT-20b, as HAT-P-20b, is thus expected to contain large amounts of heavy elements in its interior.
To investigate the internal structure of CoRoT-20b, we computed planetary evolution models with CEPAM (Guillot & Morel 1995), following the description in Guillot & Havel (2011) and Havel et al. (2011) for a planet of a total mass 4.24 MJup. We derived a time-averaged equilibrium temperature of the planet to be Teq = 1002 ± 24 K. The results for Teq = 1000 K are shown in Fig. 10 in terms of the planetary size as a function of the system age. The colored regions (green, blue, and yellow) indicate the constraints derived from the CESAM stellar evolution models (Morel & Lebreton 2008) at the 1, 2, and 3σ levels, respectively. For preferred ages between 100 Ma and 1 Ga, we find that CoRoT-20b should contain between 680 and 1040 M⊕ of heavy-elements in its interior (i.e. between 50% and 77% of the total planetary mass), at 1σ level, about twice the amount needed for HAT-P-20b (see Leconte et al. 2011). While this result is qualitatively in line with the observed correlation between stellar metallicity and heavy elements in the planet (e.g. Guillot et al. 2006; Miller & Fortney 2011, and references therein), the derived amounts are extremely surprising. They would imply that all the heavy elements of a putative gaseous protoplanetary disk of 0.1 to 0.15 M⊙ have been filtered out to form CoRoT-20b, hence that an extremely small fraction of hydrogen and helium in that disk was accreted by the planet. This is at odds with the latest accretion formation models (e.g. Ida & Lin 2004; Mordasini et al. 2009). Disk instability with differentiation and partial tidal stripping (Boley & Durisen 2010) is proposed as an alternative formation pathway. According to Boley et al. (2011), this could account for giant planets with massive cores such as HAT-P-20b. In its current orbit, CoRoT-20b does not enter the Roche limit and no tidal stripping is acting on yet but this scenario would deserve further investigations.
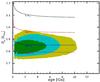 |
Fig. 10 Evolution of the size of CoRoT-20b (in Jupiter units) as a function of age (in billion years), compared to constraints inferred from CoRoT photometry, spectroscopy, radial velocimetry and stellar evolution models. Green, blue, and yellow regions correspond to the planetary radii and ages that result from stellar evolution models matching the inferred ρ⋆ – Teff – [Fe/H] uncertainty ellipse within 1σ, 2σ, and 3σ, respectively. Planetary evolution models for a planet with a solar-composition envelope over a central dense core of variable mass (0, 400, 800, and 1000 M⊕ as labelled) are shown as dashed lines. These models also assume that 1% of the incoming stellar irradiation is dissipated deep into the interior of the planet. |
We investigated the possibility that changes in the atmospheric model would yield more “reasonable” values for the planetary enrichment. As can be seen from a similar study in the brown dwarf regime (Burrows et al. 2011), the consequences of modified atmospheric properties are limited for objects with the mass of CoRoT-20b (i.e. standard radii for objects of this mass range from 1.05 to 1.20 RJup). By artificially lowering the infrared atmospheric opacity by a factor 1000 (not shown), we were able to decrease the 1σ upper limit to the core mass from 650 to 390 M⊕, a small change compared to the huge and unphysical decrease in the opacity.
On the other hand, one strong assumption in our study is that heavy elements are embedded in a central core. When relatively small amounts of heavy elements are considered, it is not very important whether they are considered as part of a core or mixed in the envelope (e.g. Ikoma et al. 2006). However, as shown by Baraffe et al. (2008), when 0.5 MJup of ices are mixed in the envelope of a 1 MJup planet, its radius is smaller by ~0.1 RJup than when one considers that these elements are part of a central core. It is thus very likely that the mass of heavy elements required to explain the radius of CoRoT-20b is high but significantly smaller than the mass considered here. Our estimates based on the Baraffe et al. (2008) calculations indicate that if mixed in the envelope, a mass of heavy elements two to three times lower than estimated in Fig. 10 would explain the observed planetary size. This would help to explain the formation of the planet, but would still require relatively extreme/unlikely scenarios.
7. Summary
We have presented the discovery of CoRoT-20b. The object belongs to the population of massive planets with orbital semi-major axes smaller than 0.1 AU, a domain of orbital periods where low and high eccentricity systems co-exist in a narrow range of orbital period. We examined the tidal stability of CoRoT-20 and found that, within the observational uncertainties, it belongs to the relatively small population of transiting planets that are considered as “Darwin-stable”, i.e. systems for which in the absence of processes extracting angular momentum from the system (i.e. stellar winds), the planet would never fall onto the central star, which would instead be spun-up and achieve triple-synchronization (equality of the orbital, planetary, and stellar spin periods). Other cases in the planetary domain are CoRoT-3b, CoRoT-6b, WASP-7, and HD 80606 (Matsumura et al. 2010). Measuring the stellar obliquity through the Rossiter-McLaughlin effect would provide additional constraints to more tightly constrain its tidal evolution and understand its orbital evolution. The expected semi-amplitude of the radial velocity anomaly of the Rossiter-McLaughlin effect is estimated to be 22 ± 5 m s-1, which is unfortunately quite difficult to detect with the present spectrographs used for the Keplerian orbit determination. Another point would be to assess the presence of additional companions in the system based on long-term radial velocity monitoring as, according to Matsumura et al. (2010), the formation path of close-in planet should be different for single-planet system and multi-planet ones. The CoRoT-20 system thus appears to be an interesting bench test case for studying the tidal orbital and rotational evolution of the close-in population.
The second interesting peculiarity that distinguishes CoRoT-20b from the regular giant planet population is its small observed radius. According to planetary evolution models, the interior of this compact planet should contain a very large amount of heavy elements, with a central dense core whose mass would be in the range between 680 and 1040 M⊕. Although mixing heavy elements in the envelopes rather than confining them to a central core can lead to substantially smaller values (by a factor estimated to be ~2−3), the origin of such a huge amount of heavy elements is difficult to explain within the framework provided by the current planetary formation models. With HAT-P-20b (Bakos et al. 2011), it is the second example of an extremely metal-rich interior that challenges planetary interior models. However, the two planetary systems differ in many aspects: HAT-P-20b is nearly twice as massive as CoRoT-20b and orbits a K3 metal rich star on a nearly circular orbit, while CoRoT-20 is a solar-type, slightly metal-enriched star. In addition, HAT-P-20 seems to be physically associated with another stellar companion, while up to now, CoRoT-20 has none, either detected or suspected. It thus appears difficult from these two exceptions to derive any trend that would provide information about the origin of these challenging and intriguing bodies.
Acknowledgments
The French team thanks the CNES for its continuous support to the CoRoT/Exoplanet program. The authors wish to thank the staff at ESO La Silla Observatory for their support and for their contribution to the success of the HARPS project and operation. The team at the IAC acknowledges support by grants ESP2007-65480-C02-02 and AYA2010-20982-C02-02 of the Spanish Ministry of Science and Innovation (MICINN). The CoRoT/Exoplanet catalogue (Exodat) was made possible by observations collected for years at the Isaac Newton Telescope (INT), operated on the island of La Palma by the Isaac Newton group in the Spanish Observatorio del Roque de Los Muchachos of the Instituto de Astrophysica de Canarias. The German CoRoT team (TLS and University of Cologne) acknowledges DLR grants 50OW0204, 50OW0603, and 50QP0701. The Swiss team acknowledges the ESA PRODEX program and the Swiss National Science Foundation for their continuous support on CoRoT ground follow-up. A. S. Bonomo acknowledges CNRS/CNES grant 07/0879-Corot. S. Aigrain acknowledges STFC grant ST/G002266. M. Gillon acknowledges support from the Belgian Science Policy Office in the form of a Return Grant.
References
- Auvergne, M., Bodin, P., Boisnard, L., et al. 2009, A&A, 506, 411 [NASA ADS] [CrossRef] [EDP Sciences] [Google Scholar]
- Baglin, A., Auvergne, M., Barge, P., et al. 2009, in IAU Symp., 253, 81 [Google Scholar]
- Bakos, G. Á., Hartman, J., Torres, G., et al. 2011, ApJ, 742, 116 [NASA ADS] [CrossRef] [Google Scholar]
- Baraffe, I., Chabrier, G., & Barman, T. 2008, A&A, 482, 315 [NASA ADS] [CrossRef] [EDP Sciences] [Google Scholar]
- Baranne, A., Queloz, D., Mayor, M., et al. 1996, A&AS, 119, 373 [NASA ADS] [CrossRef] [EDP Sciences] [Google Scholar]
- Bean, J. L. 2009, A&A, 506, 369 [NASA ADS] [CrossRef] [EDP Sciences] [Google Scholar]
- Benítez-Llambay, P., Masset, F., & Beaugé, C. 2011, A&A, 528, A2 [NASA ADS] [CrossRef] [EDP Sciences] [Google Scholar]
- Boley, A. C., & Durisen, R. H. 2010, ApJ, 724, 618 [NASA ADS] [CrossRef] [Google Scholar]
- Boley, A. C., Helled, R., & Payne, M. J. 2011, ApJ, 735, 30 [NASA ADS] [CrossRef] [Google Scholar]
- Bordé, P., Bouchy, F., Deleuil, M., et al. 2010, A&A, 520, A66 [NASA ADS] [CrossRef] [EDP Sciences] [Google Scholar]
- Borkovits, T. 2004, Publications of the Astronomy Department of the Eotvos Lorand University, 14, 207 [NASA ADS] [Google Scholar]
- Borucki, W. J., Koch, D., Basri, G., et al. 2010, Science, 327, 977 [NASA ADS] [CrossRef] [PubMed] [Google Scholar]
- Bouchy, F., Bonomo, A. S., Santerne, A., et al. 2011, A&A, 533, A83 [NASA ADS] [CrossRef] [EDP Sciences] [Google Scholar]
- Bouchy, F., Moutou, C., Queloz, D., & the CoRoT Exoplanet Science Team. 2009, in IAU Symp., 253, 129 [Google Scholar]
- Bouvier, J., Forestini, M., & Allain, S. 1997, A&A, 326, 1023 [NASA ADS] [Google Scholar]
- Bruntt, H., Bedding, T. R., Quirion, P., et al. 2010a, MNRAS, 405, 1907 [NASA ADS] [Google Scholar]
- Bruntt, H., Bikmaev, I. F., Catala, C., et al. 2004, A&A, 425, 683 [NASA ADS] [CrossRef] [EDP Sciences] [Google Scholar]
- Bruntt, H., Deleuil, M., Fridlund, M., et al. 2010b, A&A, 519, A51 [NASA ADS] [CrossRef] [EDP Sciences] [Google Scholar]
- Buchhave, L. A., Bakos, G. Á., Hartman, J. D., et al. 2010, ApJ, 720, 1118 [NASA ADS] [CrossRef] [Google Scholar]
- Burrows, A., Heng, K., & Nampaisarn, T. 2011, ApJ, 736, 47 [NASA ADS] [CrossRef] [Google Scholar]
- Claret, A. 2003, A&A, 401, 657 [NASA ADS] [CrossRef] [EDP Sciences] [Google Scholar]
- Claret, A. 2004, A&A, 428, 1001 [NASA ADS] [CrossRef] [EDP Sciences] [Google Scholar]
- Csizmadia, S., Renner, S., Barge, P., et al. 2010, A&A, 510, A94 [NASA ADS] [CrossRef] [EDP Sciences] [Google Scholar]
- Deeg, H. J., Gillon, M., Shporer, A., et al. 2009, A&A, 506, 343 [NASA ADS] [CrossRef] [EDP Sciences] [Google Scholar]
- Deleuil, M., Meunier, J. C., Moutou, C., et al. 2009, AJ, 138, 649 [NASA ADS] [CrossRef] [Google Scholar]
- Deleuil, M., Moutou, C., & Bordé, P. 2011, Detection and Dynamics of Transiting Exoplanets, St. Michel l’Observatoire, France, ed. F. Bouchy, R. Díaz & C. Moutou, EPJ Web of Conferences, 11, 1001 [Google Scholar]
- Eggleton, P. P., Kiseleva, L. G., & Hut, P. 1998, ApJ, 499, 853 [NASA ADS] [CrossRef] [Google Scholar]
- Faber, J. A., Rasio, F. A., & Willems, B. 2005, Icarus, 175, 248 [NASA ADS] [CrossRef] [Google Scholar]
- Fabrycky, D., & Tremaine, S. 2007, ApJ, 669, 1298 [NASA ADS] [CrossRef] [Google Scholar]
- Ferraz-Mello, S., Rodríguez, A., & Hussmann, H. 2008, Cel. Mech. Dyn. Astron., 101, 171 [NASA ADS] [CrossRef] [Google Scholar]
- Ford, E. B., & Rasio, F. A. 2006, ApJ, 638, L45 [NASA ADS] [CrossRef] [Google Scholar]
- Frandsen, S., & Lindberg, B. 1999, in Astrophysics with the NOT, ed. H. Karttunen & V. Piirola, 71 [Google Scholar]
- Fressin, F., Torres, G., Désert, J.-M., et al. 2011, ApJS, 197, 5 [NASA ADS] [CrossRef] [Google Scholar]
- Giménez, A. 2006, A&A, 450, 1231 [NASA ADS] [CrossRef] [EDP Sciences] [Google Scholar]
- Giménez, A. 2009, in The Eighth Pacific Rim Conference on Stellar Astrophysics: A Tribute to Kam-Ching Leung, ed. S. J. Murphy & M. S. Bessell, ASP Conf. Ser., 404, 291 [Google Scholar]
- Gonzalez, G. 1997, MNRAS, 285, 403 [NASA ADS] [CrossRef] [Google Scholar]
- Guillot, T., & Havel, M. 2011, A&A, 527, A20 [NASA ADS] [CrossRef] [EDP Sciences] [Google Scholar]
- Guillot, T., & Morel, P. 1995, A&AS, 109, 109 [NASA ADS] [Google Scholar]
- Guillot, T., Santos, N. C., Pont, F., et al. 2006, A&A, 453, L21 [NASA ADS] [CrossRef] [EDP Sciences] [Google Scholar]
- Hansen, B. M. S. 2010, ApJ, 723, 285 [NASA ADS] [CrossRef] [Google Scholar]
- Havel, M., Guillot, T., Valencia, D., & Crida, A. 2011, A&A, 531, A3 [NASA ADS] [CrossRef] [EDP Sciences] [Google Scholar]
- Hellier, C., Anderson, D. R., Collier Cameron, A., et al. 2009, Nature, 460, 1098 [NASA ADS] [CrossRef] [Google Scholar]
- Holman, M. J., Fabrycky, D. C., Ragozzine, D., et al. 2010, Science, 330, 51 [NASA ADS] [CrossRef] [PubMed] [Google Scholar]
- Hut, P. 1980, A&A, 92, 167 [NASA ADS] [Google Scholar]
- Hut, P. 1981, A&A, 99, 126 [NASA ADS] [Google Scholar]
- Ida, S., & Lin, D. N. C. 2004, ApJ, 616, 567 [NASA ADS] [CrossRef] [MathSciNet] [Google Scholar]
- Ikoma, M., Guillot, T., Genda, H., Tanigawa, T., & Ida, S. 2006, ApJ, 650, 1150 [NASA ADS] [CrossRef] [MathSciNet] [Google Scholar]
- Jackson, B., Barnes, R., & Greenberg, R. 2009, ApJ, 698, 1357 [NASA ADS] [CrossRef] [Google Scholar]
- Lainey, V., Arlot, J.-E., Karatekin, Ö., & van Hoolst, T. 2009, Nature, 459, 957 [NASA ADS] [CrossRef] [PubMed] [Google Scholar]
- Leconte, J., Chabrier, G., Baraffe, I., & Levrard, B. 2011, Detection and Dynamics of Transiting Exoplanets, St. Michel l’Observatoire, France, ed. F. Bouchy, R. Díaz & C. Moutou, EPJ Web of Conferences, 11, 110 [Google Scholar]
- Levrard, B., Winisdoerffer, C., & Chabrier, G. 2009, ApJ, 692, L9 [NASA ADS] [CrossRef] [Google Scholar]
- Lin, D. N. C., Bodenheimer, P., & Richardson, D. C. 1996, Nature, 380, 606 [NASA ADS] [CrossRef] [Google Scholar]
- Lissauer, J. J., Fabrycky, D. C., Ford, E. B., et al. 2011, Nature, 470, 53 [NASA ADS] [CrossRef] [PubMed] [Google Scholar]
- Matsumura, S., Peale, S. J., & Rasio, F. A. 2010, ApJ, 725, 1995 [NASA ADS] [CrossRef] [Google Scholar]
- Mayor, M., Pepe, F., Queloz, D., et al. 2003, The Messenger, 114, 20 [NASA ADS] [Google Scholar]
- Mignard, F. 1979, Moon and Planets, 20, 301 [Google Scholar]
- Miller, N., & Fortney, J. J. 2011, ApJ, 736, L29 [NASA ADS] [CrossRef] [Google Scholar]
- Mordasini, C., Alibert, Y., Benz, W., & Naef, D. 2009, A&A, 501, 1161 [NASA ADS] [CrossRef] [EDP Sciences] [Google Scholar]
- Morel, P., & Lebreton, Y. 2008, Ap&SS, 316, 61 [NASA ADS] [CrossRef] [MathSciNet] [Google Scholar]
- Nagasawa, M., Ida, S., & Bessho, T. 2008, ApJ, 678, 498 [NASA ADS] [CrossRef] [Google Scholar]
- Ogilvie, G. I., & Lin, D. N. C. 2004, ApJ, 610, 477 [NASA ADS] [CrossRef] [Google Scholar]
- Papaloizou, J. C. B., Nelson, R. P., Kley, W., Masset, F. S., & Artymowicz, P. 2007, Protostars and Planets V, 655 [Google Scholar]
- Pepe, F., Mayor, M., Galland, F., et al. 2002, A&A, 388, 632 [NASA ADS] [CrossRef] [EDP Sciences] [Google Scholar]
- Perruchot, S., Kohler, D., Bouchy, F., et al. 2008, in SPIE Conf. Ser., 7014 [Google Scholar]
- Pont, F., Husnoo, N., Mazeh, T., & Fabrycky, D. 2011, MNRAS, 414, 1278 [NASA ADS] [CrossRef] [Google Scholar]
- Press, W. H., Teukolsky, S. A., Vetterling, W. T., & Flannery, B. P. 1992, Numerical recipes in FORTRAN, The art of scientific computing [Google Scholar]
- Rasio, F. A., & Ford, E. B. 1996, Science, 274, 954 [NASA ADS] [CrossRef] [PubMed] [Google Scholar]
- Santerne, A., Endl, M., Hatzes, A., et al. 2011, Detection and Dynamics of Transiting Exoplanets, St. Michel l’Observatoire, France, ed. F. Bouchy, R. Díaz & C. Moutou, EPJ Web of Conferences, 11, 2001 [Google Scholar]
- Schlegel, D. J., Finkbeiner, D. P., & Davis, M. 1998, ApJ, 500, 525 [NASA ADS] [CrossRef] [Google Scholar]
- Sestito, P., & Randich, S. 2005, A&A, 442, 615 [NASA ADS] [CrossRef] [EDP Sciences] [Google Scholar]
- Sing, D. K. 2010, A&A, 510, A21 [Google Scholar]
- Southworth, J. 2010, MNRAS, 408, 1689 [NASA ADS] [CrossRef] [Google Scholar]
- Surace, C., Alonso, R., Barge, P., et al. 2008, in SPIE Conf. Ser., 7019 [Google Scholar]
- Tingley, B., Endl, M., Gazzano, J.-C., et al. 2011, A&A, 528, A97 [NASA ADS] [CrossRef] [EDP Sciences] [Google Scholar]
- Udry, S., Mayor, M., & Queloz, D. 1999, in Precise Stellar Radial Velocities, ed. J. B. Hearnshaw & C. D. Scarfe, IAU Colloq. 170, ASP Conf. Ser., 185, 367 [Google Scholar]
- Winn, J. N., Fabrycky, D., Albrecht, S., & Johnson, J. A. 2010, ApJ, 718, L145 [NASA ADS] [CrossRef] [Google Scholar]
All Tables
All Figures
|
Fig. 1 The 24.278-day long CoRoT-20 reduced light curve at a constant 512-s time sampling. |
| In the text | |
|
Fig. 2 Image of the DSS showing CoRoT-20 and its environment. The photometric mask used for CoRoT observations is overplotted on the target. |
| In the text | |
|
Fig. 3 The phase-folded radial velocity measurements of CoRoT-20. The various symbols correspond to the different spectrographs used for the follow-up campaign: HARPS (black circle), SOPHIE (open circle) and FIES (open triangle). The best-fit solution is overplotted in full line. |
| In the text | |
|
Fig. 4 Bisector span versus radial velocity of CoRoT-20 showing no correlation. |
| In the text | |
|
Fig. 5 The phase-folded transit in the phase space. The phase bins are 3.3 min and the error bar in each individual bin was calculated as the dispersion of the points inside the bin, divided by the square root of the number of points per bin. The best model is overplotted as a full line. |
| In the text | |
|
Fig. 6 Abundances of the chemical elements measured with VWA in the HARPS coadded spectrum of CoRoT-20. The abundances refer to the solar value. White circles correspond to neutral lines, red boxes to singly ionized lines, and the yellow area represents the mean metallicity within 1-σ error bar. |
| In the text | |
|
Fig. 7 CoRoT-20 spectrum in a spectral region around the Li i lines at 6708 Å. |
| In the text | |
|
Fig. 8 Tidal evolution of the orbital semi-major axis and eccentricity. The figure is displayed on a time interval larger than the expected lifetime of the star to show the triple synchronization characteristic of a Darwin-stable system. |
| In the text | |
|
Fig. 9 Tidal evolution of the rotational and orbital periods. |
| In the text | |
|
Fig. 10 Evolution of the size of CoRoT-20b (in Jupiter units) as a function of age (in billion years), compared to constraints inferred from CoRoT photometry, spectroscopy, radial velocimetry and stellar evolution models. Green, blue, and yellow regions correspond to the planetary radii and ages that result from stellar evolution models matching the inferred ρ⋆ – Teff – [Fe/H] uncertainty ellipse within 1σ, 2σ, and 3σ, respectively. Planetary evolution models for a planet with a solar-composition envelope over a central dense core of variable mass (0, 400, 800, and 1000 M⊕ as labelled) are shown as dashed lines. These models also assume that 1% of the incoming stellar irradiation is dissipated deep into the interior of the planet. |
| In the text | |
Current usage metrics show cumulative count of Article Views (full-text article views including HTML views, PDF and ePub downloads, according to the available data) and Abstracts Views on Vision4Press platform.
Data correspond to usage on the plateform after 2015. The current usage metrics is available 48-96 hours after online publication and is updated daily on week days.
Initial download of the metrics may take a while.