Free Access
Fig. 5
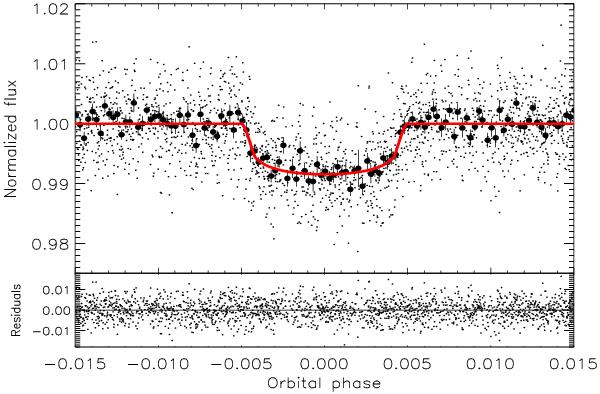
The phase-folded transit in the phase space. The phase bins are 3.3 min and the error bar in each individual bin was calculated as the dispersion of the points inside the bin, divided by the square root of the number of points per bin. The best model is overplotted as a full line.
Current usage metrics show cumulative count of Article Views (full-text article views including HTML views, PDF and ePub downloads, according to the available data) and Abstracts Views on Vision4Press platform.
Data correspond to usage on the plateform after 2015. The current usage metrics is available 48-96 hours after online publication and is updated daily on week days.
Initial download of the metrics may take a while.