Free Access
Fig. 7
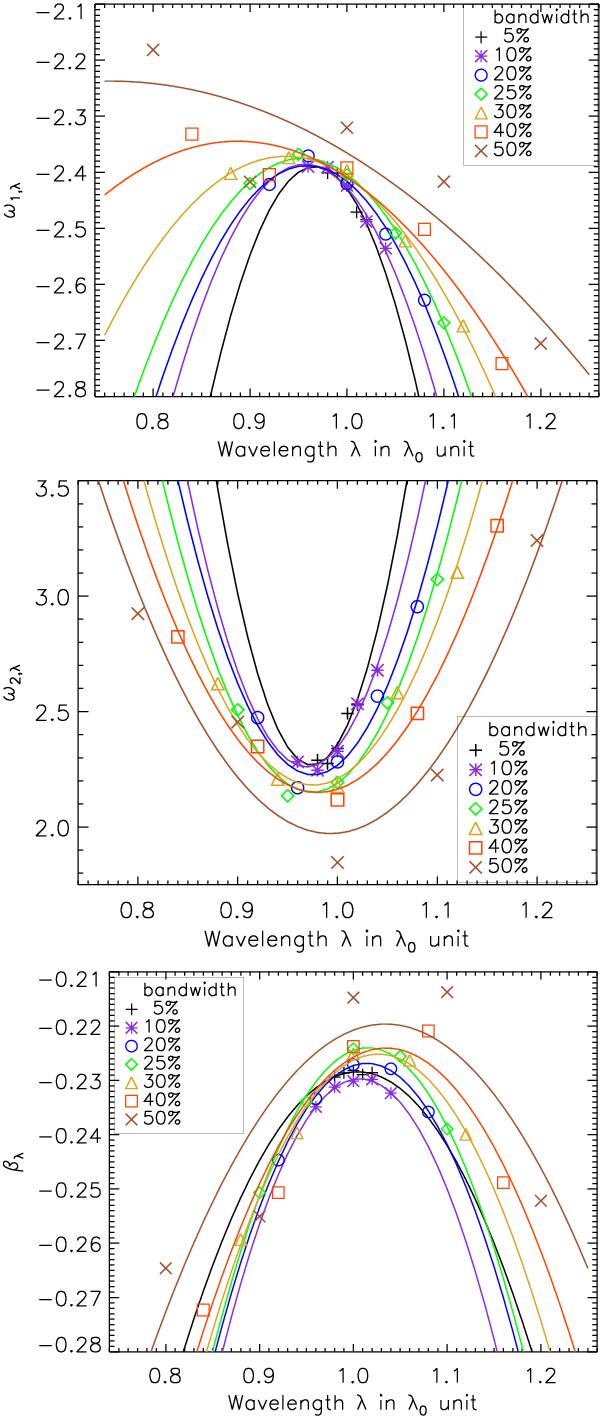
Optimized values of the amplitude apodization parameter ω1,λ (top plot), ω2,λ (middle) and the phase apodization parameter βλ (bottom) as a function of the wavelength for different bandwidths. A second-degree polynomial interpolation of the points is represented for each parameter and bandwidth.
This figure is made of several images, please see below:
Current usage metrics show cumulative count of Article Views (full-text article views including HTML views, PDF and ePub downloads, according to the available data) and Abstracts Views on Vision4Press platform.
Data correspond to usage on the plateform after 2015. The current usage metrics is available 48-96 hours after online publication and is updated daily on week days.
Initial download of the metrics may take a while.