Fig. 6
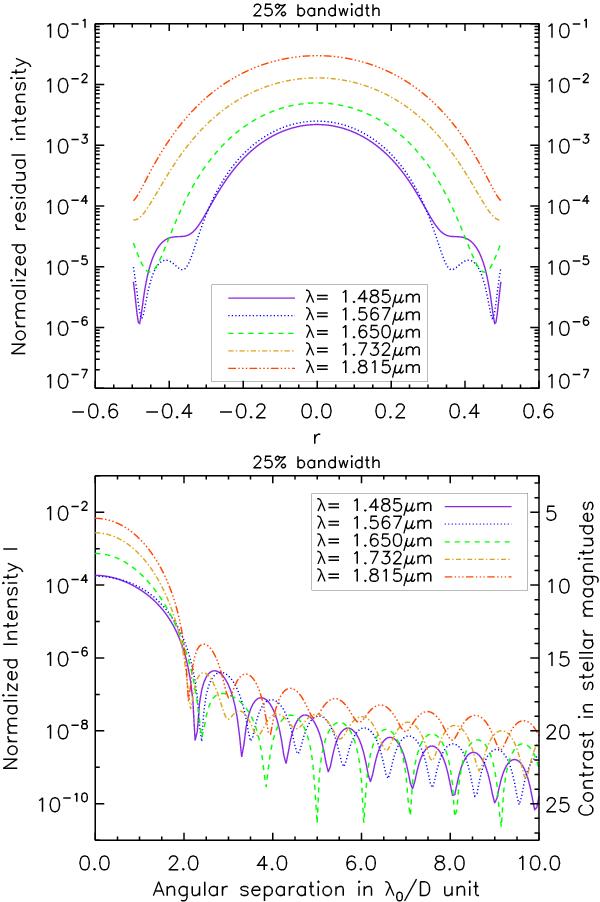
Radial profiles of the residual intensity with the CAPM coronagraph, within the re-imaged pupil in plane C (top) and in the final image plane D (bottom) at different wavelengths λ. Profiles have been normalized at the origin to directly read the coronagraphic extinction ratio at a given angular distance from the on-axis star image.
Current usage metrics show cumulative count of Article Views (full-text article views including HTML views, PDF and ePub downloads, according to the available data) and Abstracts Views on Vision4Press platform.
Data correspond to usage on the plateform after 2015. The current usage metrics is available 48-96 hours after online publication and is updated daily on week days.
Initial download of the metrics may take a while.