Free Access
Fig. 23
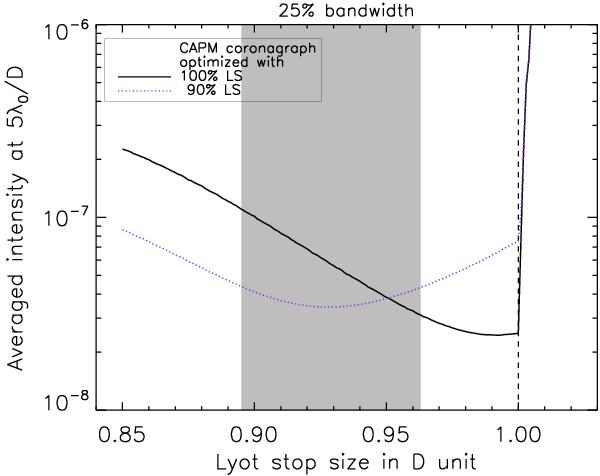
Theoretical averaged intensity at 5 λ0/D achieved with the CAPM coronagraph as a function of the Lyot stop (LS) size. The dashed line represents the edge of the geometrical relayed pupil. The gray area represents the tolerance range, defined in the text, for the CAPM coronagraph optimized with 90% LS.
Current usage metrics show cumulative count of Article Views (full-text article views including HTML views, PDF and ePub downloads, according to the available data) and Abstracts Views on Vision4Press platform.
Data correspond to usage on the plateform after 2015. The current usage metrics is available 48-96 hours after online publication and is updated daily on week days.
Initial download of the metrics may take a while.