Free Access
Fig. 21
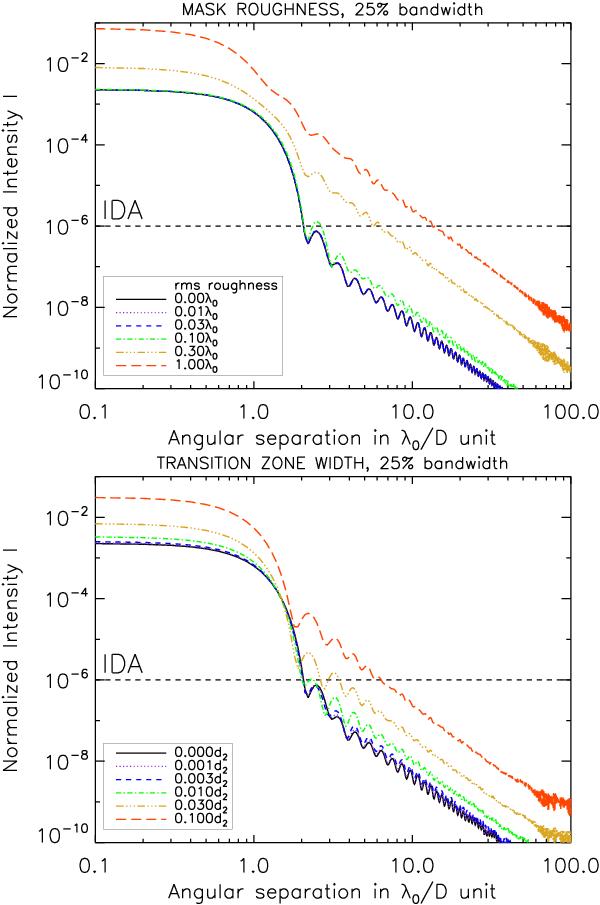
Radial intensity profiles of the coronagraphic images theoretically achieved with the CAPM coronagraph for different rms values of mask roughness (top plot) and for different sizes of mask transition width, expressed in DZPM diameter d2 (bottom).
This figure is made of several images, please see below:
Current usage metrics show cumulative count of Article Views (full-text article views including HTML views, PDF and ePub downloads, according to the available data) and Abstracts Views on Vision4Press platform.
Data correspond to usage on the plateform after 2015. The current usage metrics is available 48-96 hours after online publication and is updated daily on week days.
Initial download of the metrics may take a while.