Fig. 14
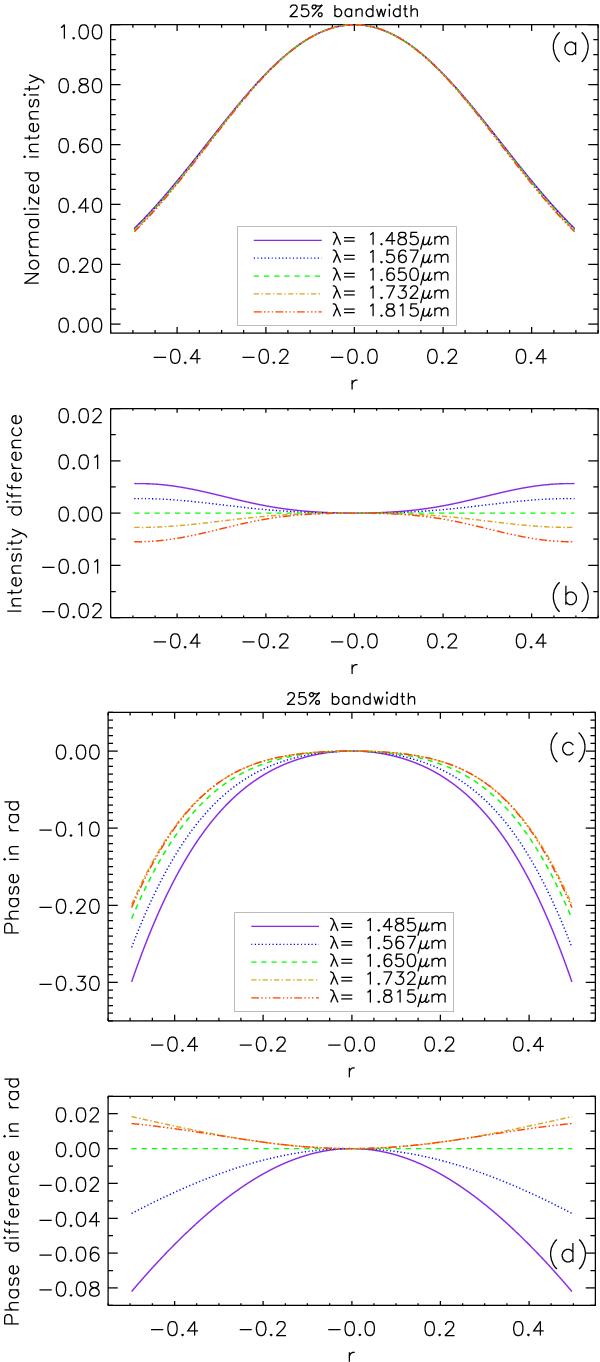
a) Radial intensity profile of the colored apodizer, made with an assembly using nickel layer, for the CAPM coronagraph at different wavelengths λ; b) radial profiles of the difference between the intensity apodization at a given wavelength λ and that obtained at the central wavelength λ0 (here 1.650 μm); c) and d) reproduce a) and b) respectively for the phase given by the phase apodization Φw.
Current usage metrics show cumulative count of Article Views (full-text article views including HTML views, PDF and ePub downloads, according to the available data) and Abstracts Views on Vision4Press platform.
Data correspond to usage on the plateform after 2015. The current usage metrics is available 48-96 hours after online publication and is updated daily on week days.
Initial download of the metrics may take a while.