Free Access
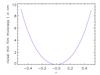
Fig. 13
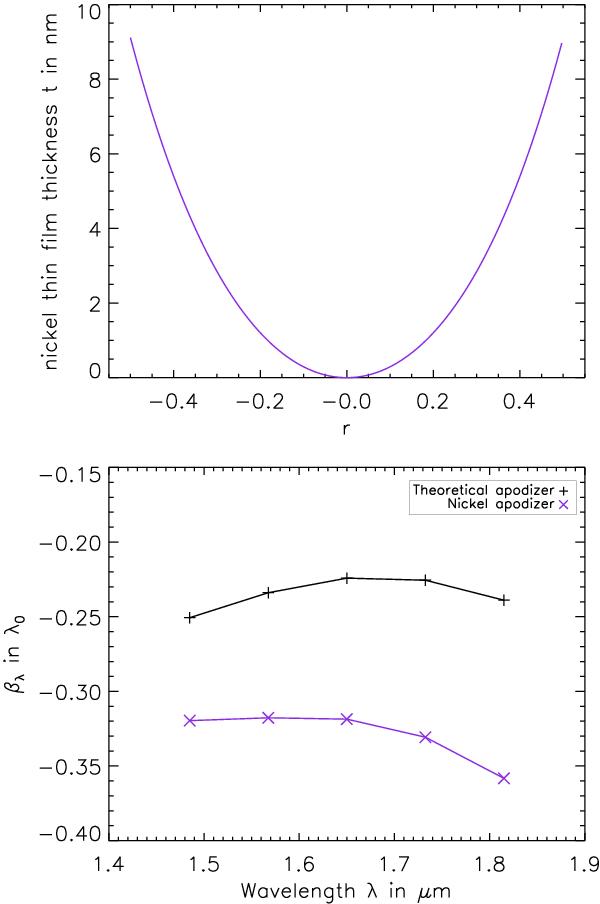
Top: thickness profile of the nickel layer as a function of the wavelength. Bottom: optimized values of the phase apodization parameter βλ for the CAPM coronagraph in the presence of the theoretical model and the physical design as a colored amplitude apodization.
This figure is made of several images, please see below:
Current usage metrics show cumulative count of Article Views (full-text article views including HTML views, PDF and ePub downloads, according to the available data) and Abstracts Views on Vision4Press platform.
Data correspond to usage on the plateform after 2015. The current usage metrics is available 48-96 hours after online publication and is updated daily on week days.
Initial download of the metrics may take a while.