Fig. 8
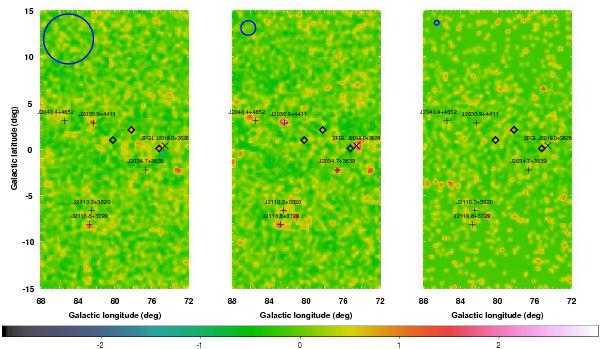
Residuals (data-model). Left: low energies (100 MeV–1 GeV); center: mid-energies (1 GeV–10 GeV); right: high energies (10 GeV–100 GeV). Units are approximate standard deviations (square root of model counts) saturated between ± 3 and smoothed for display with a Gaussian kernel of σ = 0.25°. In each panel the blue circle in the top left corner represents the effective LAT PSF 68% containment circle for the event selection used in the analysis (averaged over the corresponding energy range assuming a power-law spectrum with index 2.1). Diamonds mark the positions of bright pulsars for which phase selection was applied, as in Fig. 2. Crosses mark the positions of unassociated 1FGL sources coincident with positive residuals; the X point mark the position of 2FGL J2018.0 + 3626, coincident with a hot spot in the residual map 1 GeV–10 GeV.
Current usage metrics show cumulative count of Article Views (full-text article views including HTML views, PDF and ePub downloads, according to the available data) and Abstracts Views on Vision4Press platform.
Data correspond to usage on the plateform after 2015. The current usage metrics is available 48-96 hours after online publication and is updated daily on week days.
Initial download of the metrics may take a while.