Fig. 7
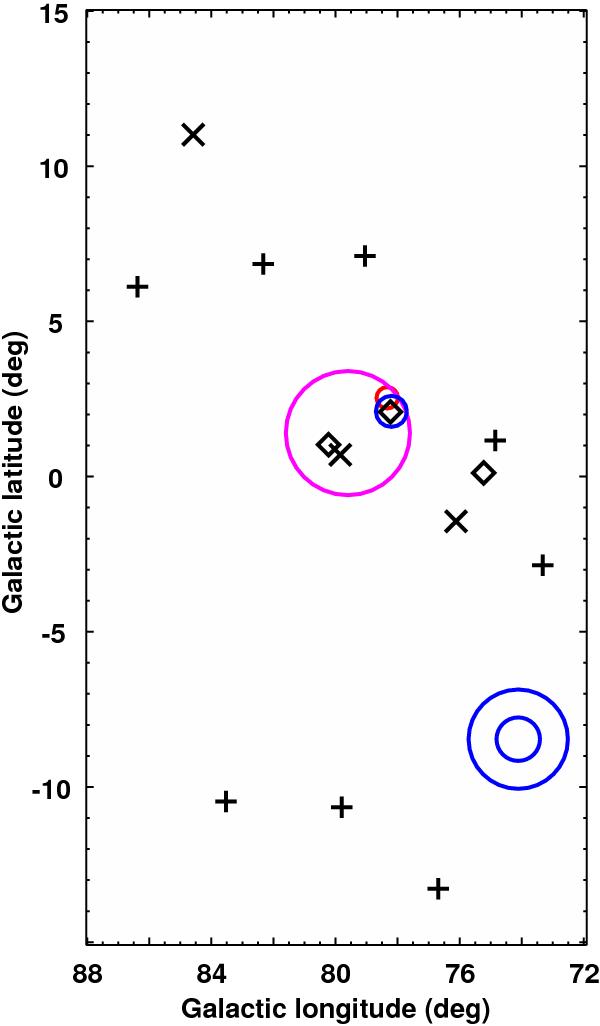
Sources included in the analysis model. Diamonds mark the positions of the three bright pulsars that were dimmed by phase selection (Sect. 2.1.2). X points mark the positions of other identified sources. Crosses correspond to 1FGL sources either associated to AGN or variable, or both, confirmed by our analysis. The blue circles correspond to the rims of the templates adopted to model SNRs, the Cygnus Loop (G74.0−8.5) and γ Cygni (G78.2 + 2.1). The red circle marks the centroid of VER 2019 + 407 (whose extension is not appreciable in this large-scale view). The magenta circle represents the 1σ contour of the Gaussian used to model the cocoon.
Current usage metrics show cumulative count of Article Views (full-text article views including HTML views, PDF and ePub downloads, according to the available data) and Abstracts Views on Vision4Press platform.
Data correspond to usage on the plateform after 2015. The current usage metrics is available 48-96 hours after online publication and is updated daily on week days.
Initial download of the metrics may take a while.