Free Access
Fig. 5
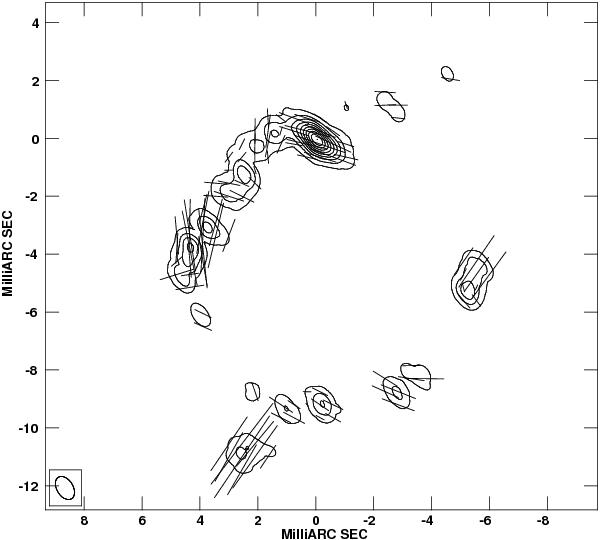
Contour plot of the Stokes I image at levels [1, 2, 5, 10, 20, 40, 80, 100]% of the peak. Vectors are overlaid proportional to the linearly polarized intensity (on a scale 1 mas = 1.25 Jy beam-1) and drawn at a position angle of the EVPA. All Stokes parameters (I, Q, U) are summed over velocity.
Current usage metrics show cumulative count of Article Views (full-text article views including HTML views, PDF and ePub downloads, according to the available data) and Abstracts Views on Vision4Press platform.
Data correspond to usage on the plateform after 2015. The current usage metrics is available 48-96 hours after online publication and is updated daily on week days.
Initial download of the metrics may take a while.