Fig. 2
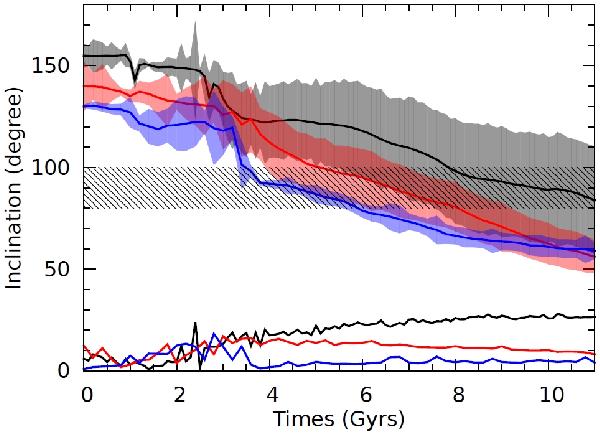
Inclination angle between disc, loop, and orbital planes as a function of time. The lower solid lines show the angle between the loop and the orbital planes. Lines within shaded regions indicate the inclination angles of the disc plane relative to the orbital plane, while the line-shaded region around 90 degrees indicates the angles between disc and loop planes that are consistent with the observations. Different colour lines show the simulations with different initial disc inclinations to the orbital plane. All the models used here have a mass ratio of 3 (from bottom to top, models M3L12, M3L23, M3L34B).
Current usage metrics show cumulative count of Article Views (full-text article views including HTML views, PDF and ePub downloads, according to the available data) and Abstracts Views on Vision4Press platform.
Data correspond to usage on the plateform after 2015. The current usage metrics is available 48-96 hours after online publication and is updated daily on week days.
Initial download of the metrics may take a while.