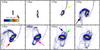
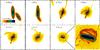
Fig. 1

Star and gas particles distributions for a merger with mass ration 3 (model M3L34A) at different epochs. Star particles are shown in the top two rows. The fit to best observations is at 8.6 Gyr, at which the structures of third and fourth loops can match the observations. The gas surface density is shown in the bottom two panels with gas density indicated by the colour bar. The size of each panel is 300 by 300 kpc and the arrows are explained in the text.
Current usage metrics show cumulative count of Article Views (full-text article views including HTML views, PDF and ePub downloads, according to the available data) and Abstracts Views on Vision4Press platform.
Data correspond to usage on the plateform after 2015. The current usage metrics is available 48-96 hours after online publication and is updated daily on week days.
Initial download of the metrics may take a while.