Fig. 8
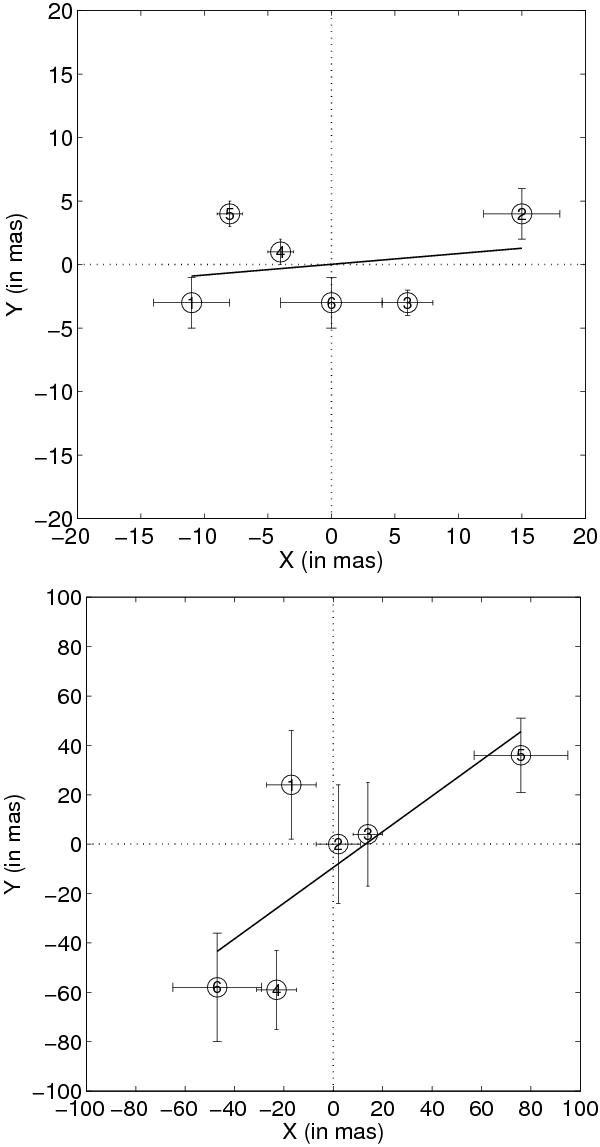
Observed astrometric variability of the photocenter, measured for SDSS J121855.80+020002.1 at z = 0.327 (up) and SDSS J162011.28+172427.5 (MRK 877) at z = 0.112438 (down), during the period 2007–2009 (see Table 3). The straight solid lines in the panels represent linear fits through the observed positions. Notations of points from 1 to 5 correspond to the observational epochs from first to the last as given in Table 3.
Current usage metrics show cumulative count of Article Views (full-text article views including HTML views, PDF and ePub downloads, according to the available data) and Abstracts Views on Vision4Press platform.
Data correspond to usage on the plateform after 2015. The current usage metrics is available 48-96 hours after online publication and is updated daily on week days.
Initial download of the metrics may take a while.