Fig. 53
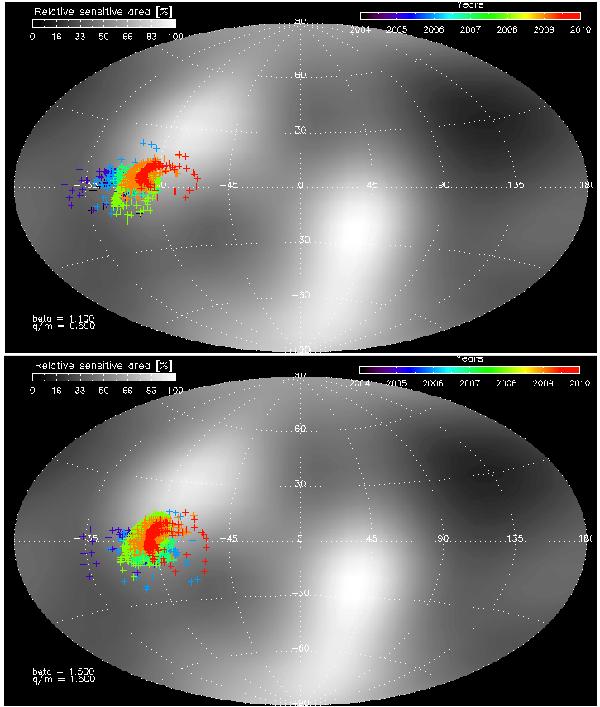
Integrated sensitivity map of the Cassini Cosmic Dust Analyser, over the years 2004 until 2010. The crosses are simulations of dust impacts, colored according to impact year. The plot is drawn in the ecliptic frame and abberation due to spacecraft motion is taken into account. This “smears” out the directionality of the dust impacts over the instrument field of view. The upper plot shows the simulated impacts for dust with β = 1.1, Q/m = 0.59 C/kg, and the lower plot shows the simulated impacts for β = 1.5, Q/m = 1.5 C/kg. The whiter the background color, the longer Cassini CDA has been pointed towards that region of the sky.
Current usage metrics show cumulative count of Article Views (full-text article views including HTML views, PDF and ePub downloads, according to the available data) and Abstracts Views on Vision4Press platform.
Data correspond to usage on the plateform after 2015. The current usage metrics is available 48-96 hours after online publication and is updated daily on week days.
Initial download of the metrics may take a while.