Fig. 27
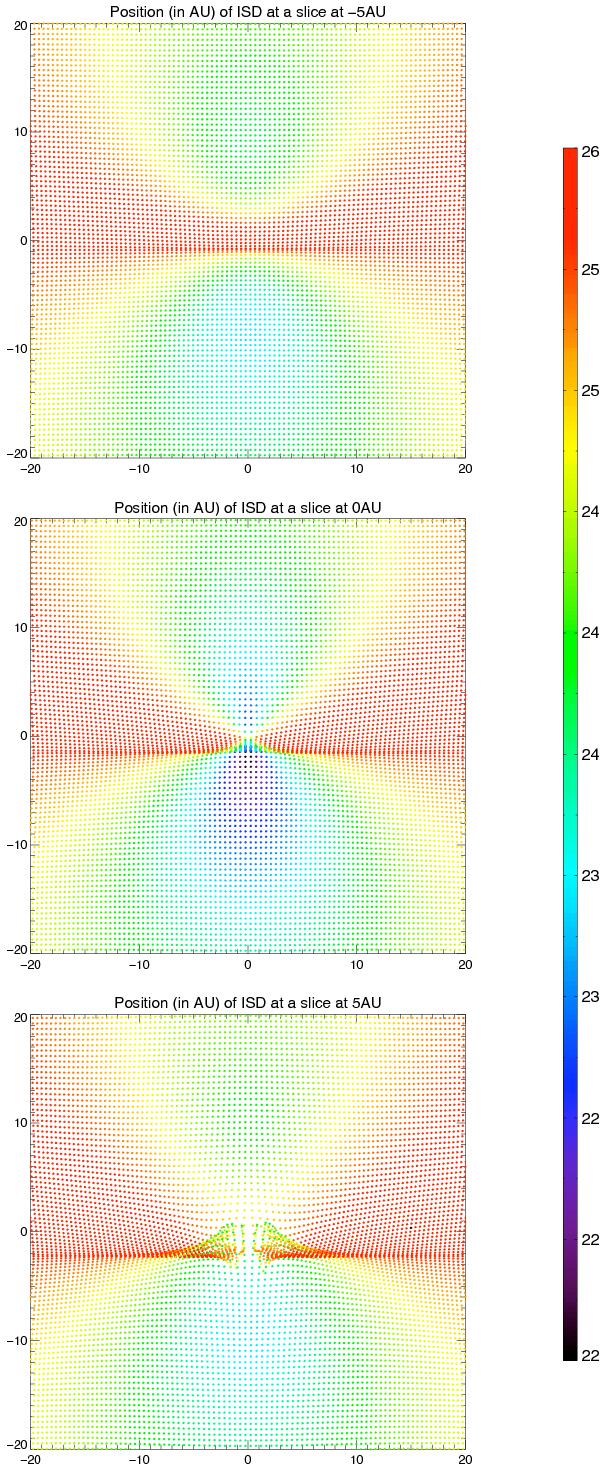
Several cross-sections through the trajectories at different distances from the Sun (− 5 AU, 0 AU, and 5 AU) in the ISD-frame. The trajectories shown are for particles with β = 1.0 and Q/m = 0.5, started in 2000 at −50 AU from the Sun. The focusing effect of the Lorentz force is visible. This plot is directly comparable to the two corresponding trajectory plots (Figs. 17 and 21).
Current usage metrics show cumulative count of Article Views (full-text article views including HTML views, PDF and ePub downloads, according to the available data) and Abstracts Views on Vision4Press platform.
Data correspond to usage on the plateform after 2015. The current usage metrics is available 48-96 hours after online publication and is updated daily on week days.
Initial download of the metrics may take a while.